
Kubernetes the not so hard way? Part 4
"Observabilityyyy" **Spongebob imagination voice**

Who doesn’t want insights into their cluster? If you are running it on MiniKube, sure you probably don’t need Prometheus and Grafana. But if you plan on somewhat productionizing your cluster, I would hope that you also plan on having insights into the cluster.
What is Prometheus and Grafana?
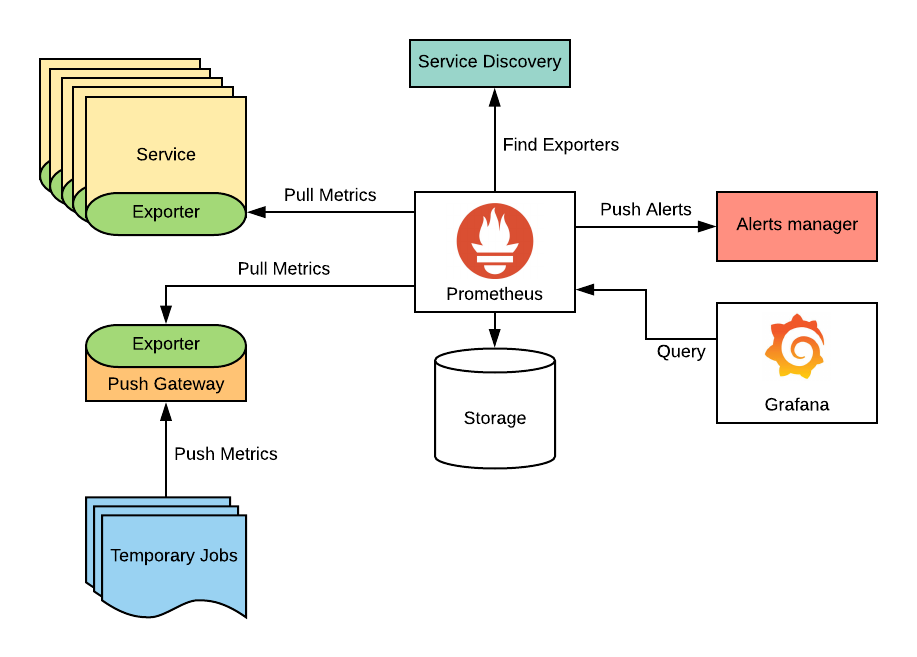
Prometheus gathers and stores metrics from hosts (nodes) via exporters and stores them in a time series database. Prometheus can also trigger and visualize the data and alerts via AlertManager.
Grafana is a visualization tool that queries the metrics from Prometheus and displays them in more consumable dashboards. Grafana can also be used for alerting.
All in all, Prometheus and Grafana provide an open-source observability solution for Kubernetes. Aside from not having the premium support you would have if you were to get your observability from a SaaS company, Prometheus + Grafana fits the needs of most companies, startups, and hobbyists looking for monitoring/observability over their Kubernetes clusters.
Configuration
If you’ve followed along to this point, you have a working Kubernetes cluster with a load balancer, persistent storage, and ingress controller. To install Prometheus and Grafana, all that’s needed is the secret of the admin username and password, a helm values file, and an ingressRoute to Grafana. Thank you again to Techno Tim for the great walkthrough.
echo -n 'admin' > ./admin-user
echo -n 'password1234!' > ./admin-password # change the password
Values.yaml:
fullnameOverride: prometheus

defaultRules:
  create: true
  rules:
    alertmanager: true
    etcd: true
    configReloaders: true
    general: true
    k8s: true
    kubeApiserverAvailability: true
    kubeApiserverBurnrate: true
    kubeApiserverHistogram: true
    kubeApiserverSlos: true
    kubelet: true
    kubeProxy: true
    kubePrometheusGeneral: true
    kubePrometheusNodeRecording: true
    kubernetesApps: true
    kubernetesResources: true
    kubernetesStorage: true
    kubernetesSystem: true
    kubeScheduler: true
    kubeStateMetrics: true
    network: true
    node: true
    nodeExporterAlerting: true
    nodeExporterRecording: true
    prometheus: true
    prometheusOperator: true

alertmanager:
  fullnameOverride: alertmanager
  enabled: true
  ingress:
    enabled: false

grafana:
  enabled: true
  fullnameOverride: grafana
  forceDeployDatasources: false
  forceDeployDashboards: false
  defaultDashboardsEnabled: true
  defaultDashboardsTimezone: utc
  serviceMonitor:
    enabled: true
  admin:
    existingSecret: grafana-admin-credentials
    userKey: admin-user
    passwordKey: admin-password

kubeApiServer:
  enabled: true

kubelet:
  enabled: true
  serviceMonitor:
    metricRelabelings:
      - action: replace
        sourceLabels:
          - node
        targetLabel: instance

kubeControllerManager:
  enabled: true
  endpoints: # IPs of control plane nodes
    - x.x.x.x
    - x.x.x.x
    - x.x.x.x

coreDns:
  enabled: true

kubeDns:
  enabled: false

kubeEtcd:
  enabled: true
  endpoints: # IPs of control plane nodes
    - x.x.x.x
    - x.x.x.x
    - x.x.x.x
  service:
    enabled: true
    port: 2381
    targetPort: 2381

kubeScheduler:
  enabled: true
  endpoints: # IPs of control plane nodes
    - x.x.x.x
    - x.x.x.x
    - x.x.x.x

kubeProxy:
  enabled: true
  endpoints: # IPs of control plane nodes
    - x.x.x.x
    - x.x.x.x
    - x.x.x.x

kubeStateMetrics:
  enabled: true

kube-state-metrics:
  fullnameOverride: kube-state-metrics
  selfMonitor:
    enabled: true
  prometheus:
    monitor:
      enabled: true
      relabelings:
        - action: replace
          regex: (.*)
          replacement: $1
          sourceLabels:
            - __meta_kubernetes_pod_node_name
          targetLabel: kubernetes_node

nodeExporter:
  enabled: true
  serviceMonitor:
    relabelings:
      - action: replace
        regex: (.*)
        replacement: $1
        sourceLabels:
          - __meta_kubernetes_pod_node_name
        targetLabel: kubernetes_node

prometheus-node-exporter:
  fullnameOverride: node-exporter
  podLabels:
    jobLabel: node-exporter
  extraArgs:
    - --collector.filesystem.mount-points-exclude=^/(dev|proc|sys|var/lib/docker/.+|var/lib/kubelet/.+)($|/)
    - --collector.filesystem.fs-types-exclude=^(autofs|binfmt_misc|bpf|cgroup2?|configfs|debugfs|devpts|devtmpfs|fusectl|hugetlbfs|iso9660|mqueue|nsfs|overlay|proc|procfs|pstore|rpc_pipefs|securityfs|selinuxfs|squashfs|sysfs|tracefs)$
  service:
    portName: http-metrics
  prometheus:
    monitor:
      enabled: true
      relabelings:
        - action: replace
          regex: (.*)
          replacement: $1
          sourceLabels:
            - __meta_kubernetes_pod_node_name
          targetLabel: kubernetes_node
  resources:
    requests:
      memory: 64Mi
      cpu: 60m
    limits:
      memory: 256Mi
      cpu: 200m

prometheusOperator:
  enabled: true
  prometheusConfigReloader:
    resources:
      requests:
        cpu: 50m
        memory: 25Mi
      limits:
        memory: 100Mi
        cpu: 150m

prometheus:
  enabled: true
  prometheusSpec:
    replicas: 1
    replicaExternalLabelName: "replica"
    ruleSelectorNilUsesHelmValues: false
    serviceMonitorSelectorNilUsesHelmValues: false
    podMonitorSelectorNilUsesHelmValues: false
    probeSelectorNilUsesHelmValues: false
    retention: 6h
    enableAdminAPI: true
    walCompression: true
    storageSpec:
      volumeClaimTemplate:
        spec:
          storageClassName: mayastor-loki-localpv # Name of the Mayastor Storage Class
          accessModes: ["ReadWriteOnce"]
          resources:
            requests:
              storage: 10Gi

thanosRuler:
  enabled: false
kubectl create ns monitoringhelm install -n monitoring prometheus prometheus-community/kube-prometheus-stack -f values.yamlgrafana-ingress.yaml:
apiVersion: traefik.containo.us/v1alpha1
kind: IngressRoute
metadata:
  name: grafana-ingress
  namespace: monitoring
  annotations:
    kubernetes.io/ingress.class: traefik-external
spec:
  entryPoints:
    - websecure
  routes:
    - match: Host(`grafana.home.domain.name`)
      kind: Rule
      services:
        - name: grafana
          port: 80
          sticky:
            cookie:
              httpOnly: true
              name: grafana
              secure: true
              sameSite: none
  tls:
    secretName: cloud-grafana-tls # Cert-manager certificate
Create a CNAME to the hostname for the Grafana service and access it in your browser.
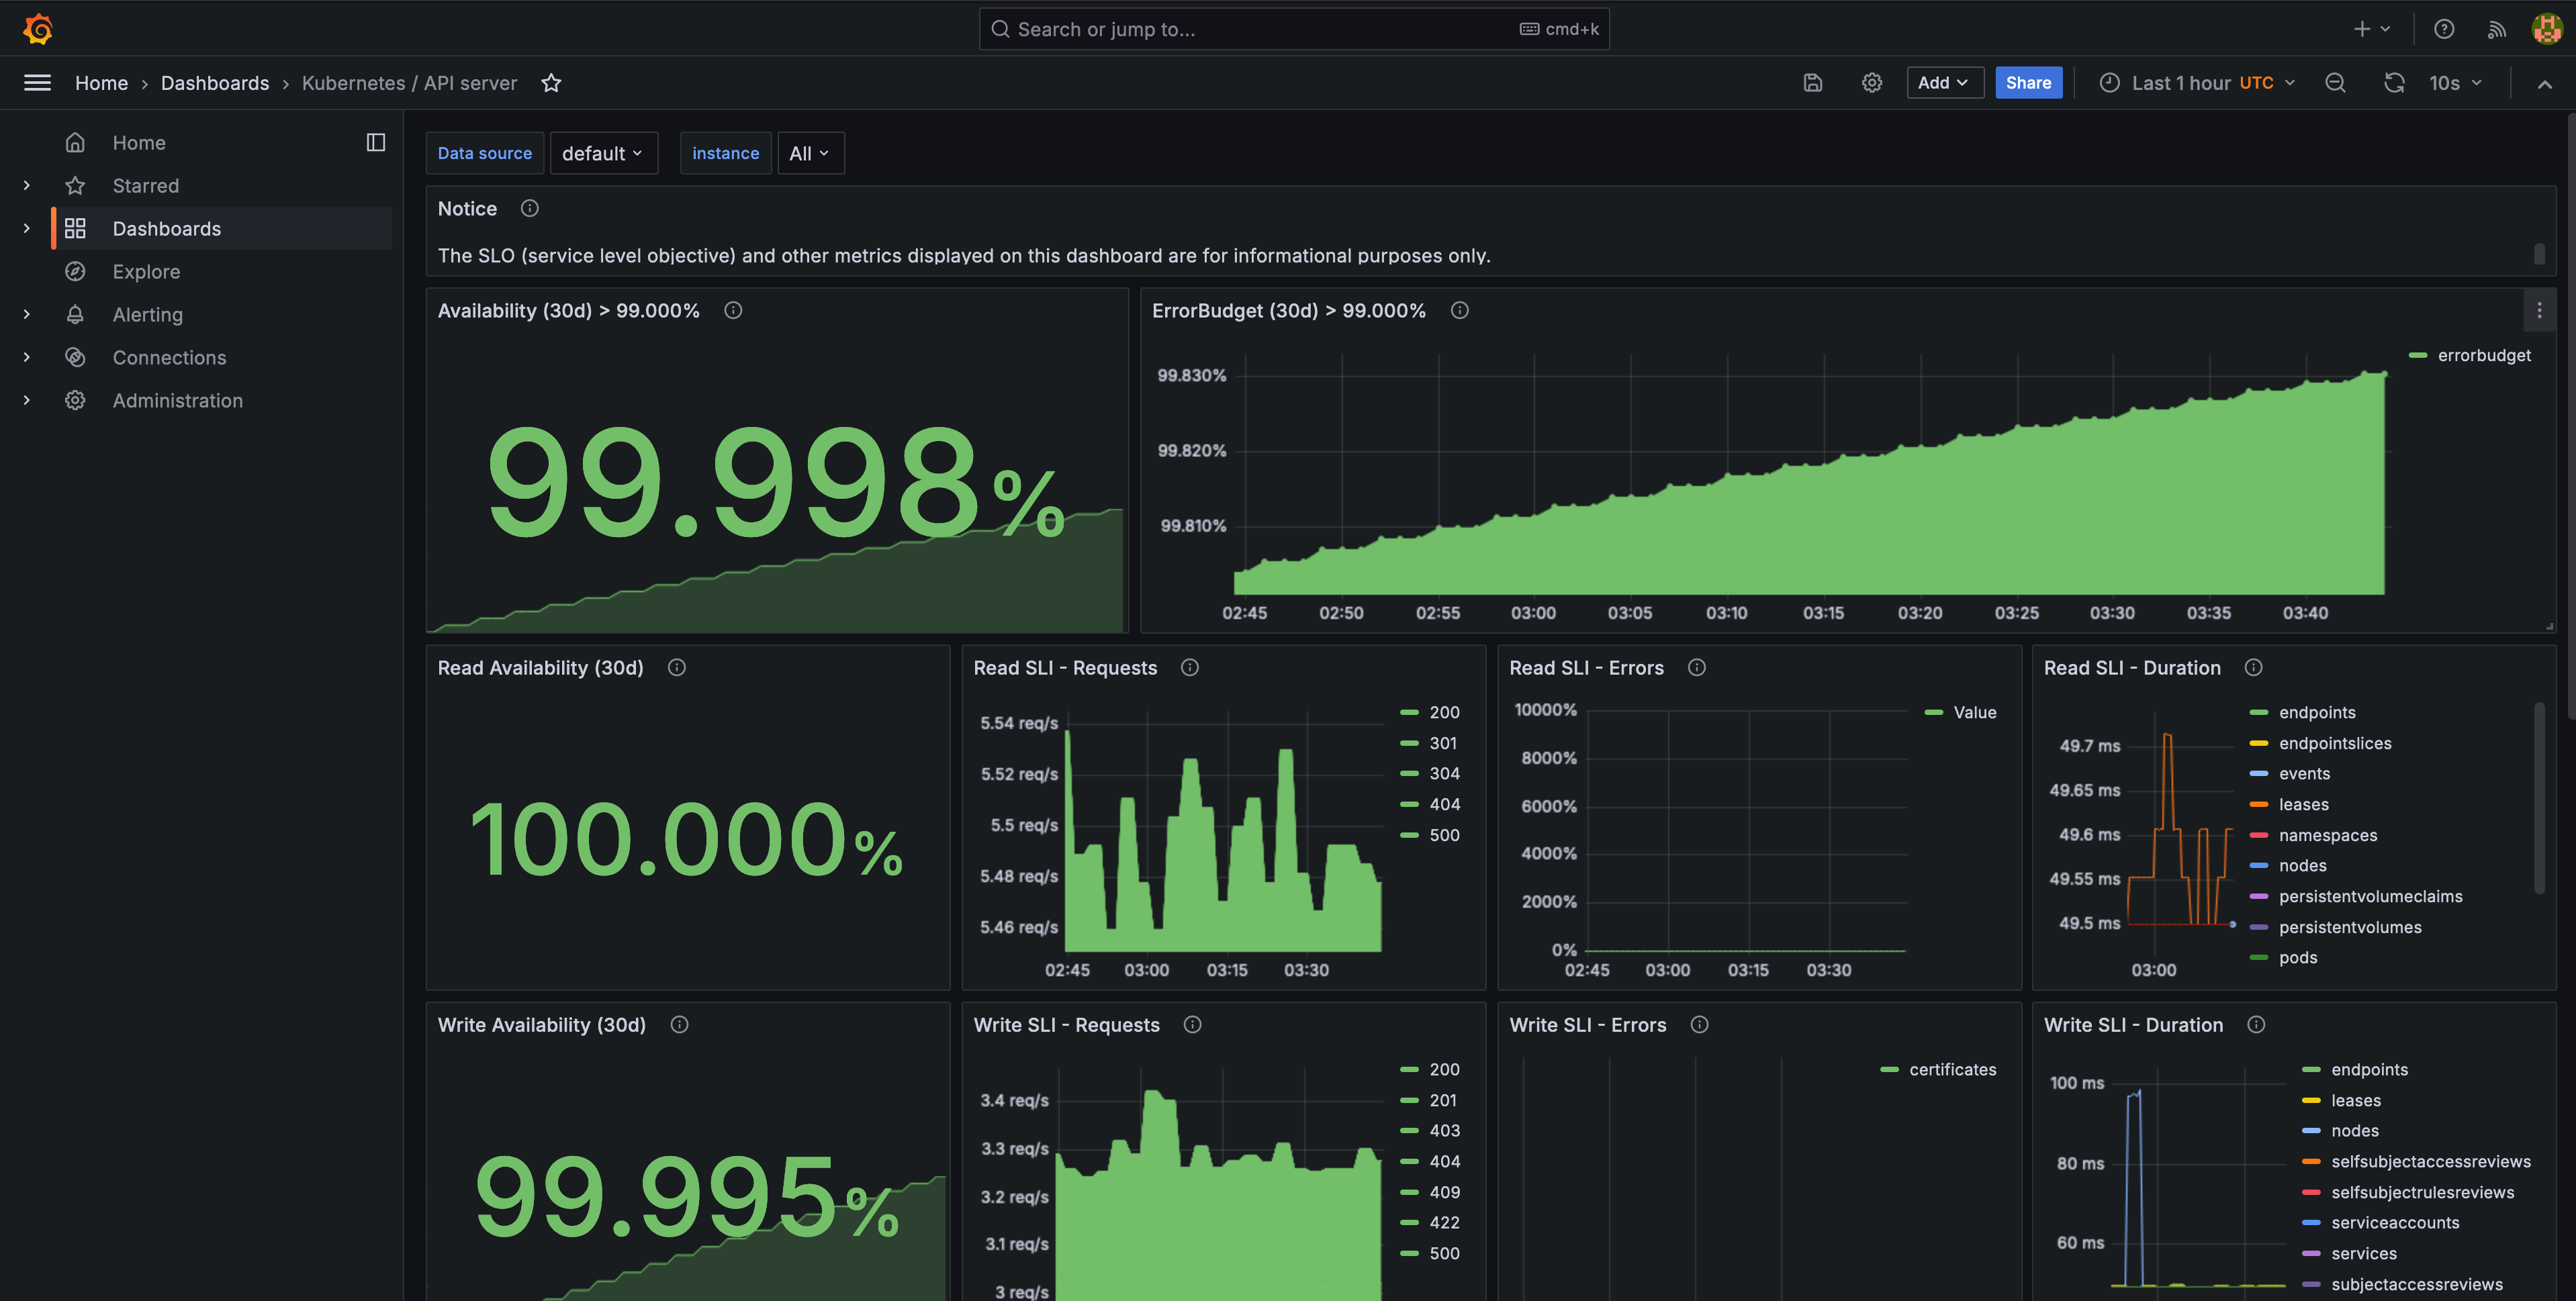
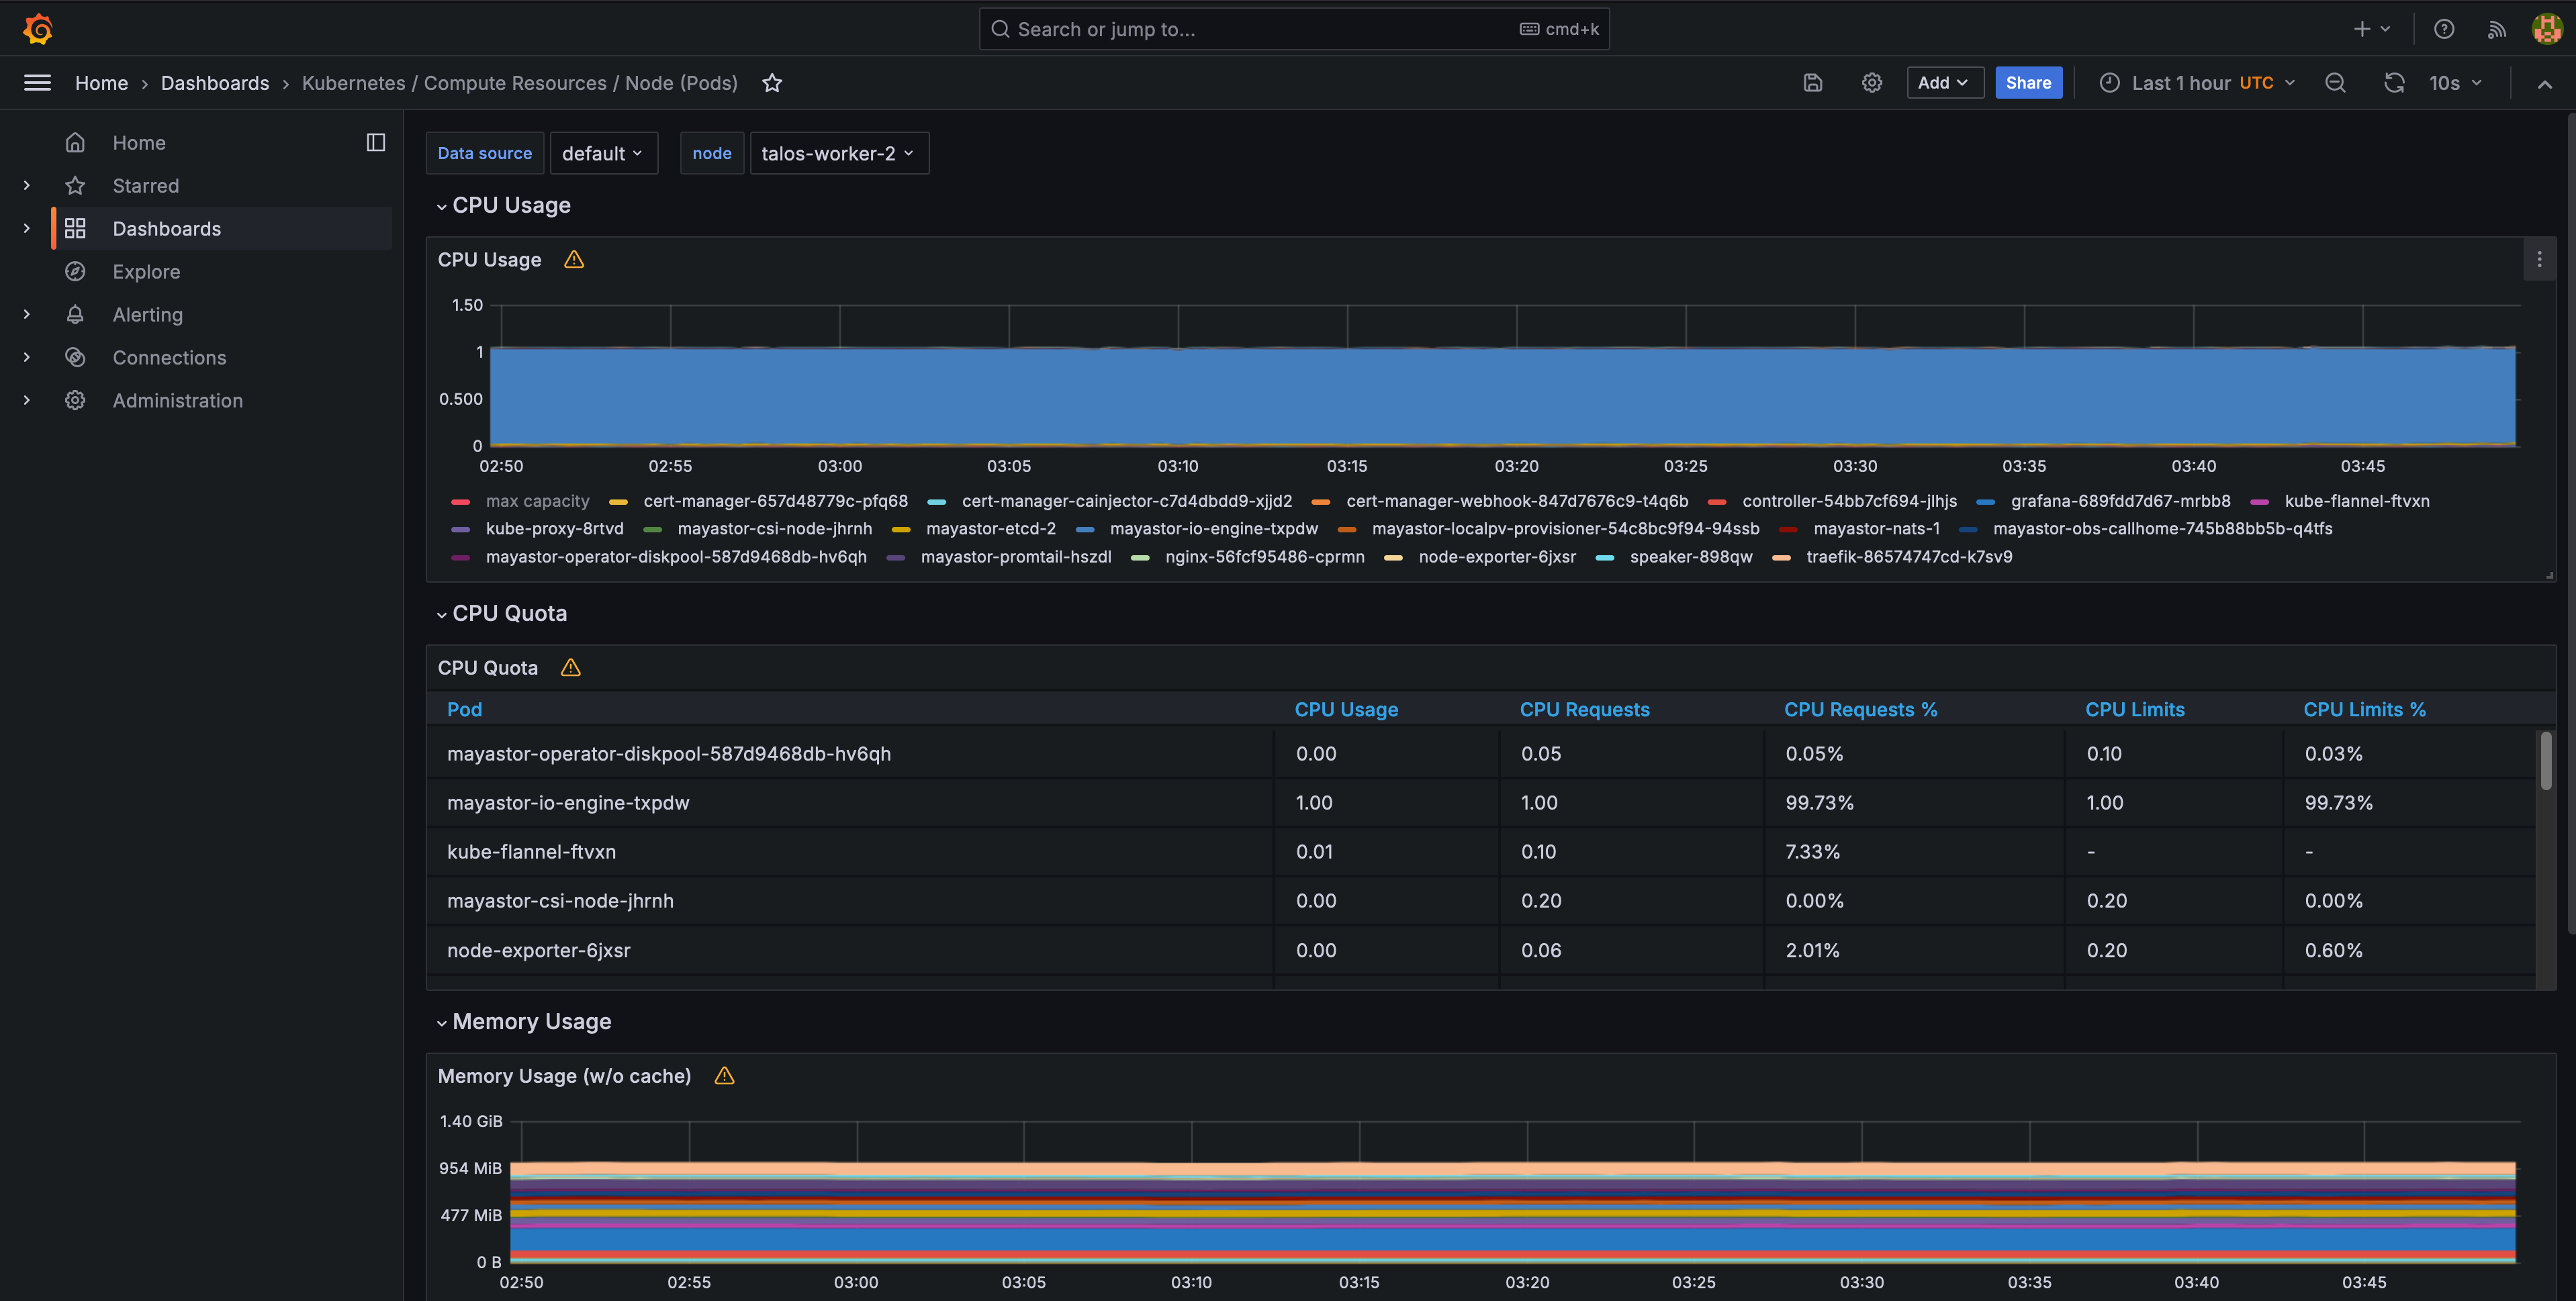
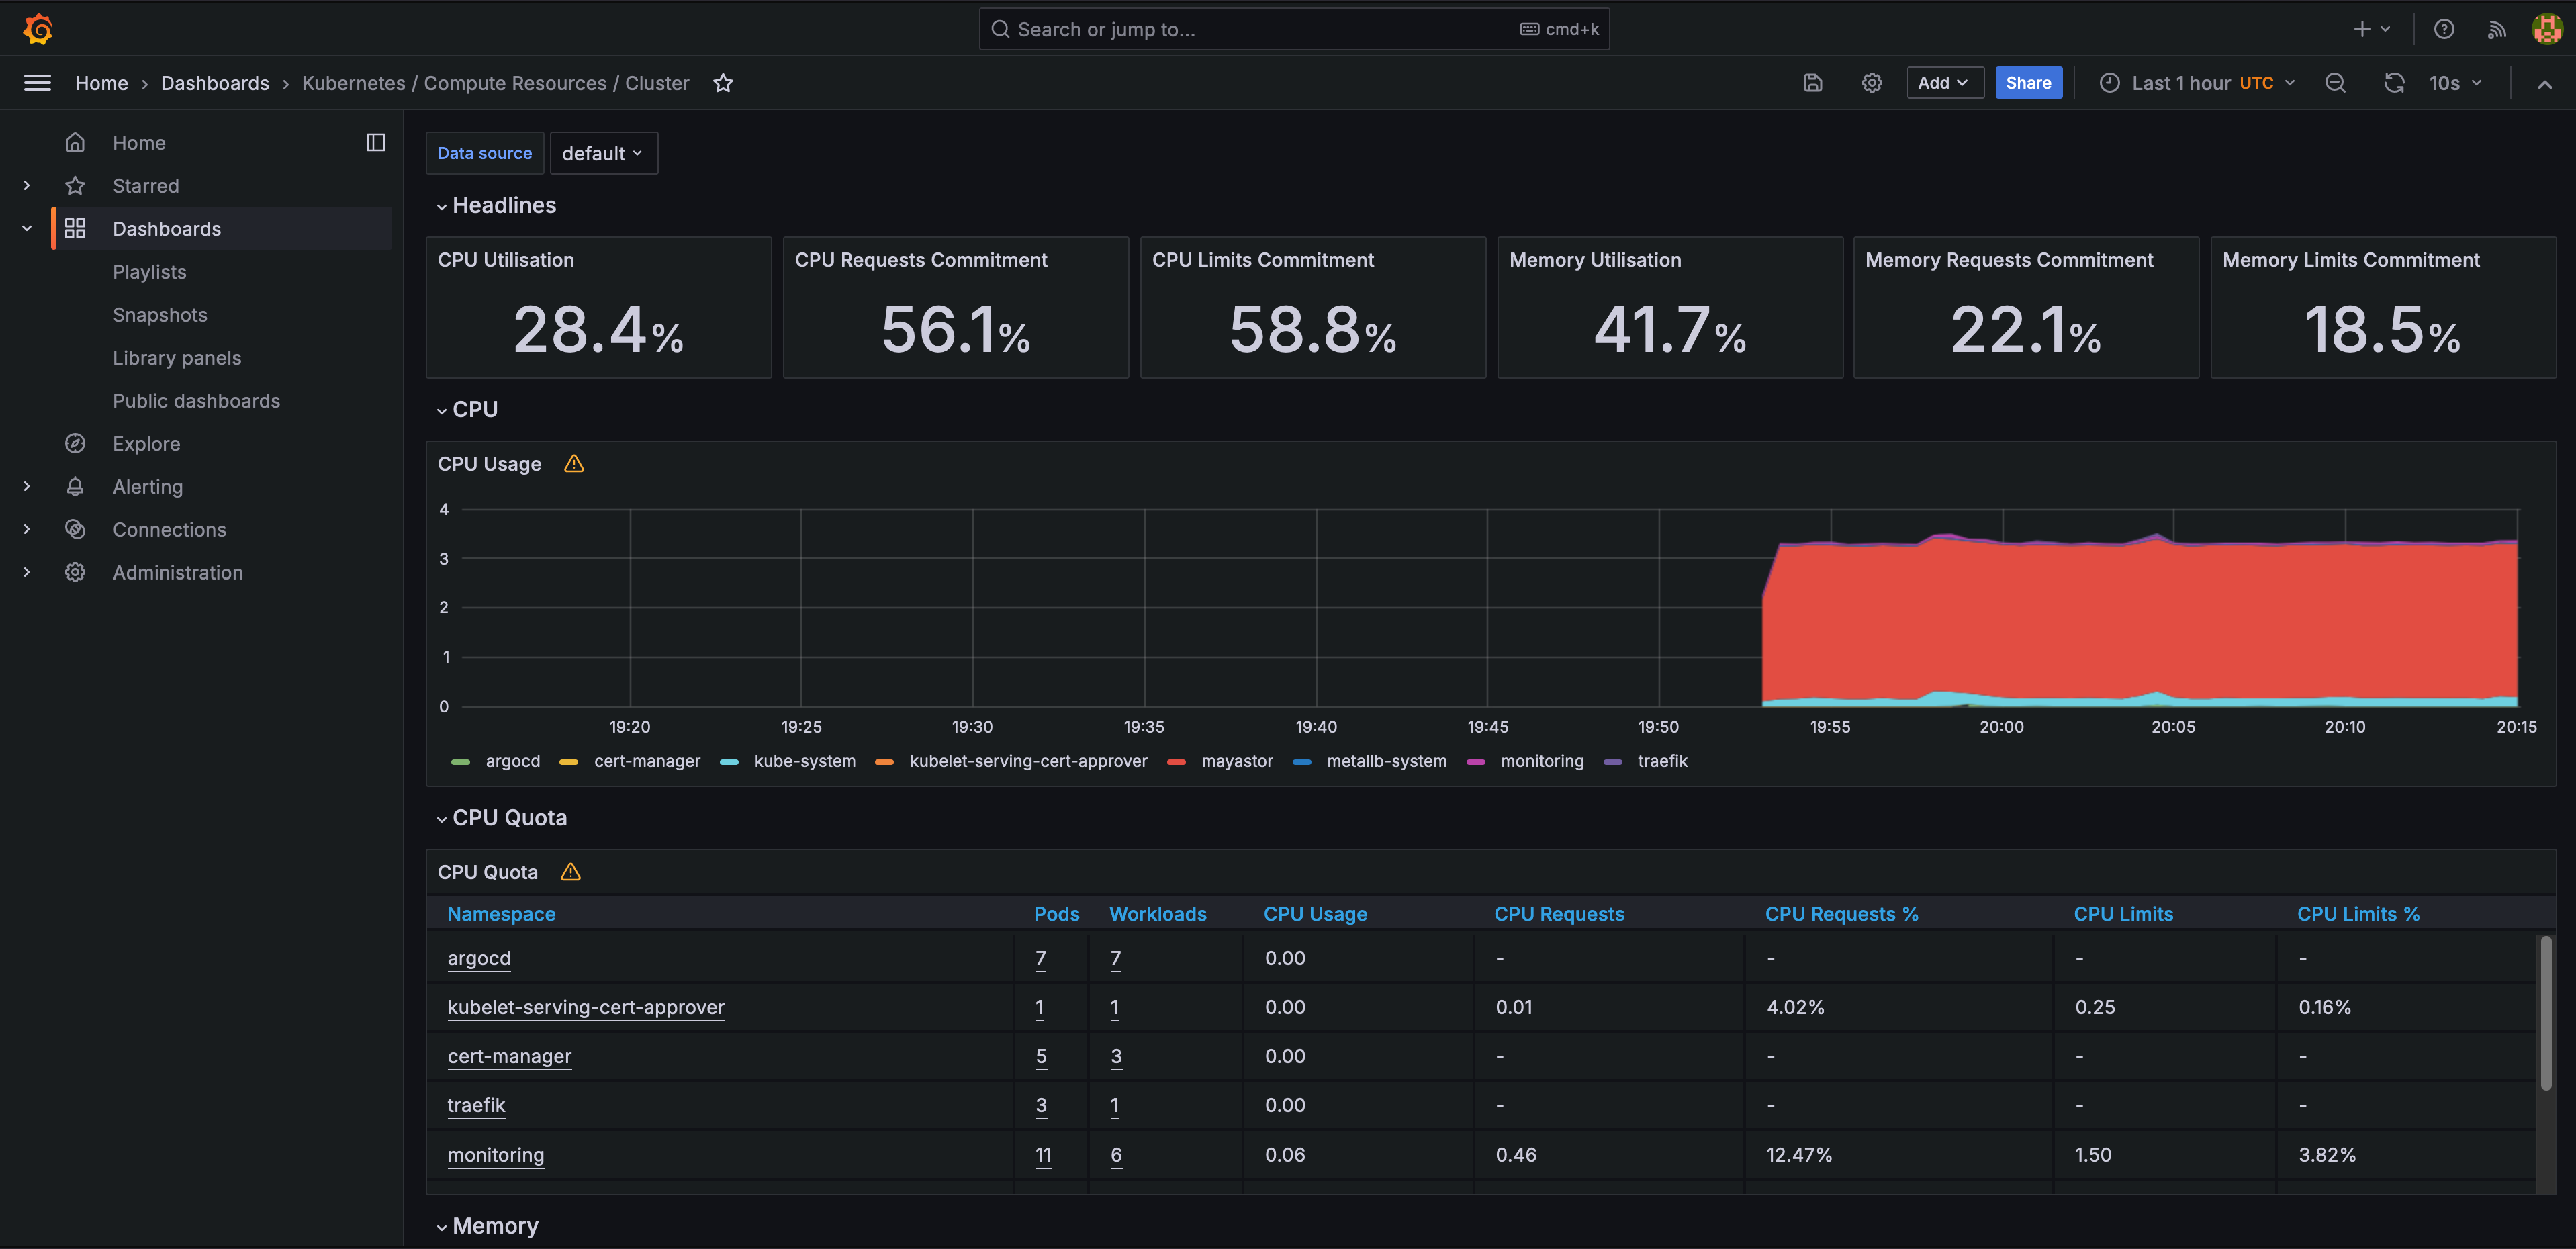
Granfana will come with a lot of Kubernetes dashboards out of the box for monitoring your cluster:
Conclusion
Thank you for reading if you’ve made it this far. Look forward to more Kubernetes, Docker, and container-related content in the future!