
Out of Town Operations
One alert a day keeps the worry away.

All green on this page means I don’t have to VPN in at 3 am.
I’ve been traveling nonstop for a while and have some more in the forefront. I’m writing this very blog post from the hotel room. Whilst being away, I would love for my server(s) to not go down. I’m continuing to do my best job of maturing redundancy, high availability, backup, and monitoring of my services and homelab.
Before my UPS, waking up to no internet without knowing about it was a terrible feeling. After getting my UPS, the UPS switching from on-line to on-battery without knowing about it is also a terrible feeling. Vault server goes down? Bye-bye secrets. Kubernetes workload stuck in CrashLoopbackOff? Sucks for me. Is DNS not working? There goes the internet.
Monitoring
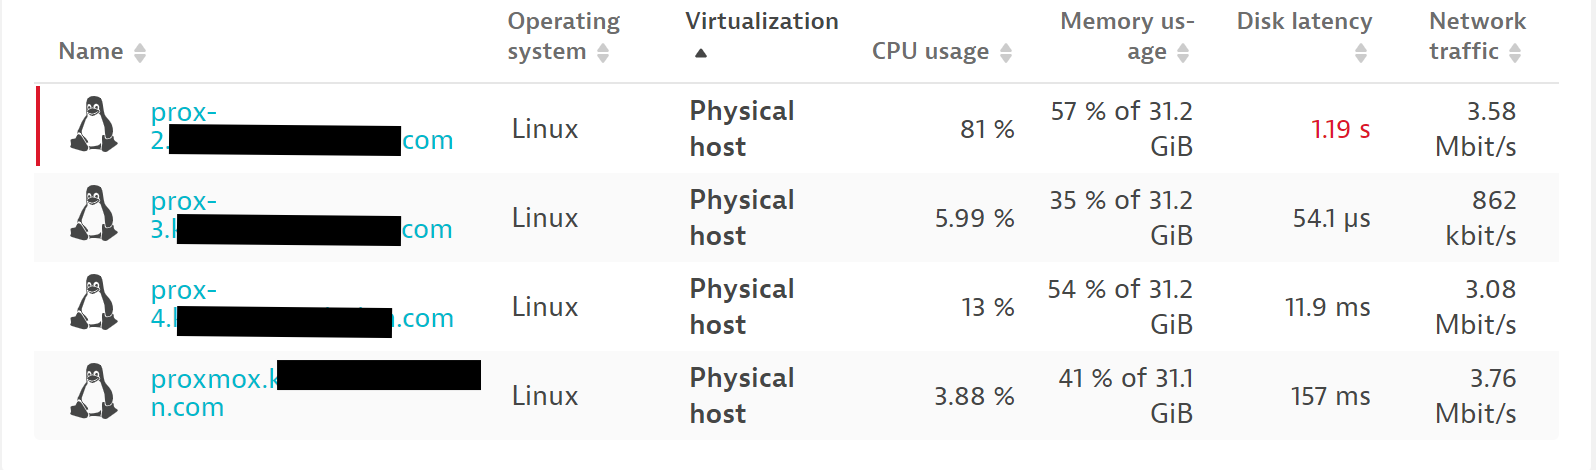
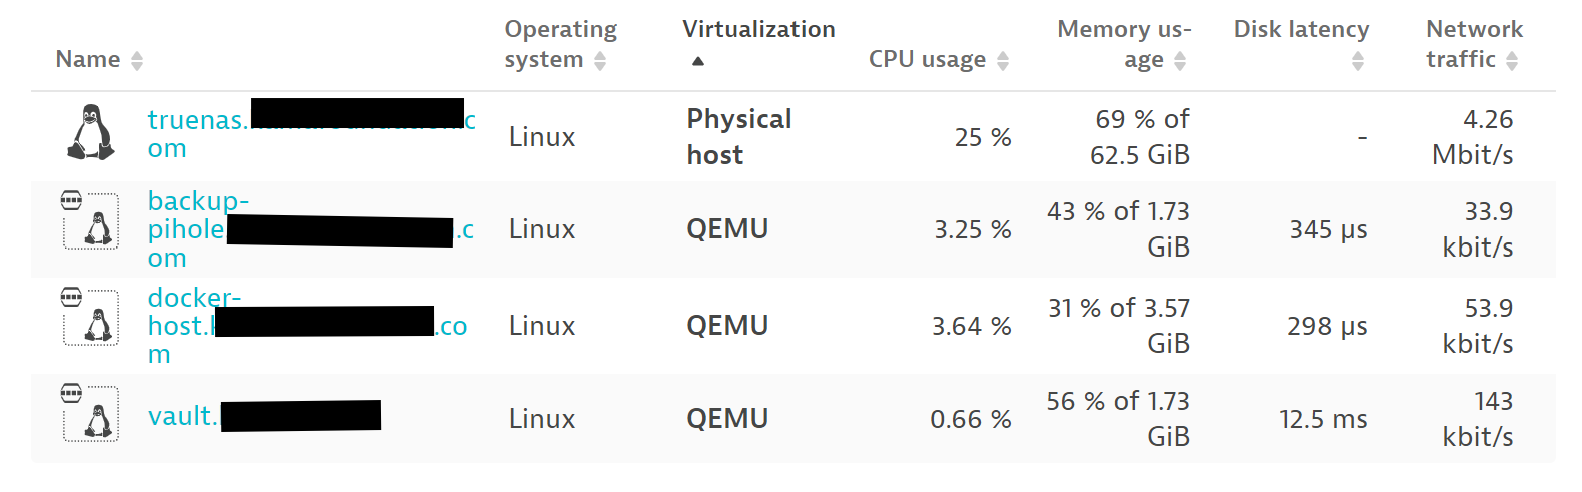
OneAgent
My first step is to make sure I know what’s happening on each server. If one of my NUCs is screaming because the CPU is saturated, preferably I would want to get an alert. If a host goes offline, I’d want to know. For that, I use Dynatrace’s OneAgent on most hosts both physical and virtual, and set up custom alerts to be sent to a Discord server. In most cases, the installation is 2-3 commands and takes 2-10 minutes. See the docs: Install OneAgent on Linux - Dynatrace Docs.
Alerting
Dynatrace doesn’t natively integrate with Discord, I would hope that an Enterprise isn’t running their “chatops” off of Discord. But me being a “home enterprise”, that doesn’t apply. You can set a custom integration for problem notifications using a secret webhook URL in Settings → Integration → Problem Notifications:
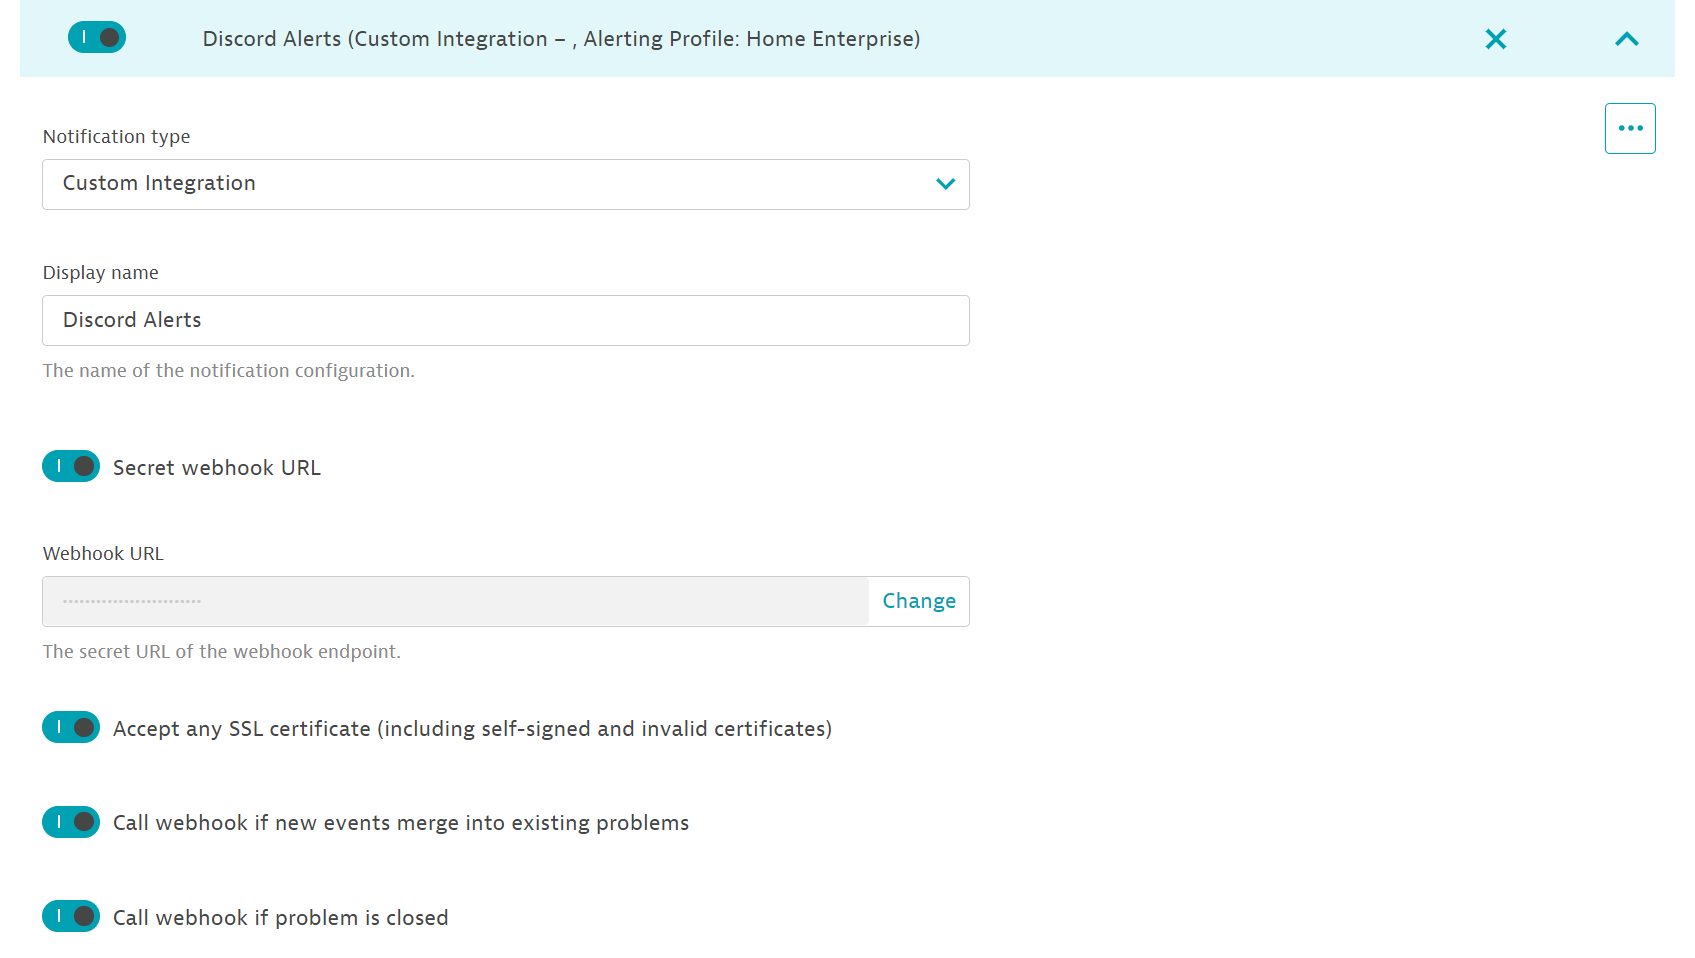
A custom payload must be defined or calling the webhook will result in 4XXs:
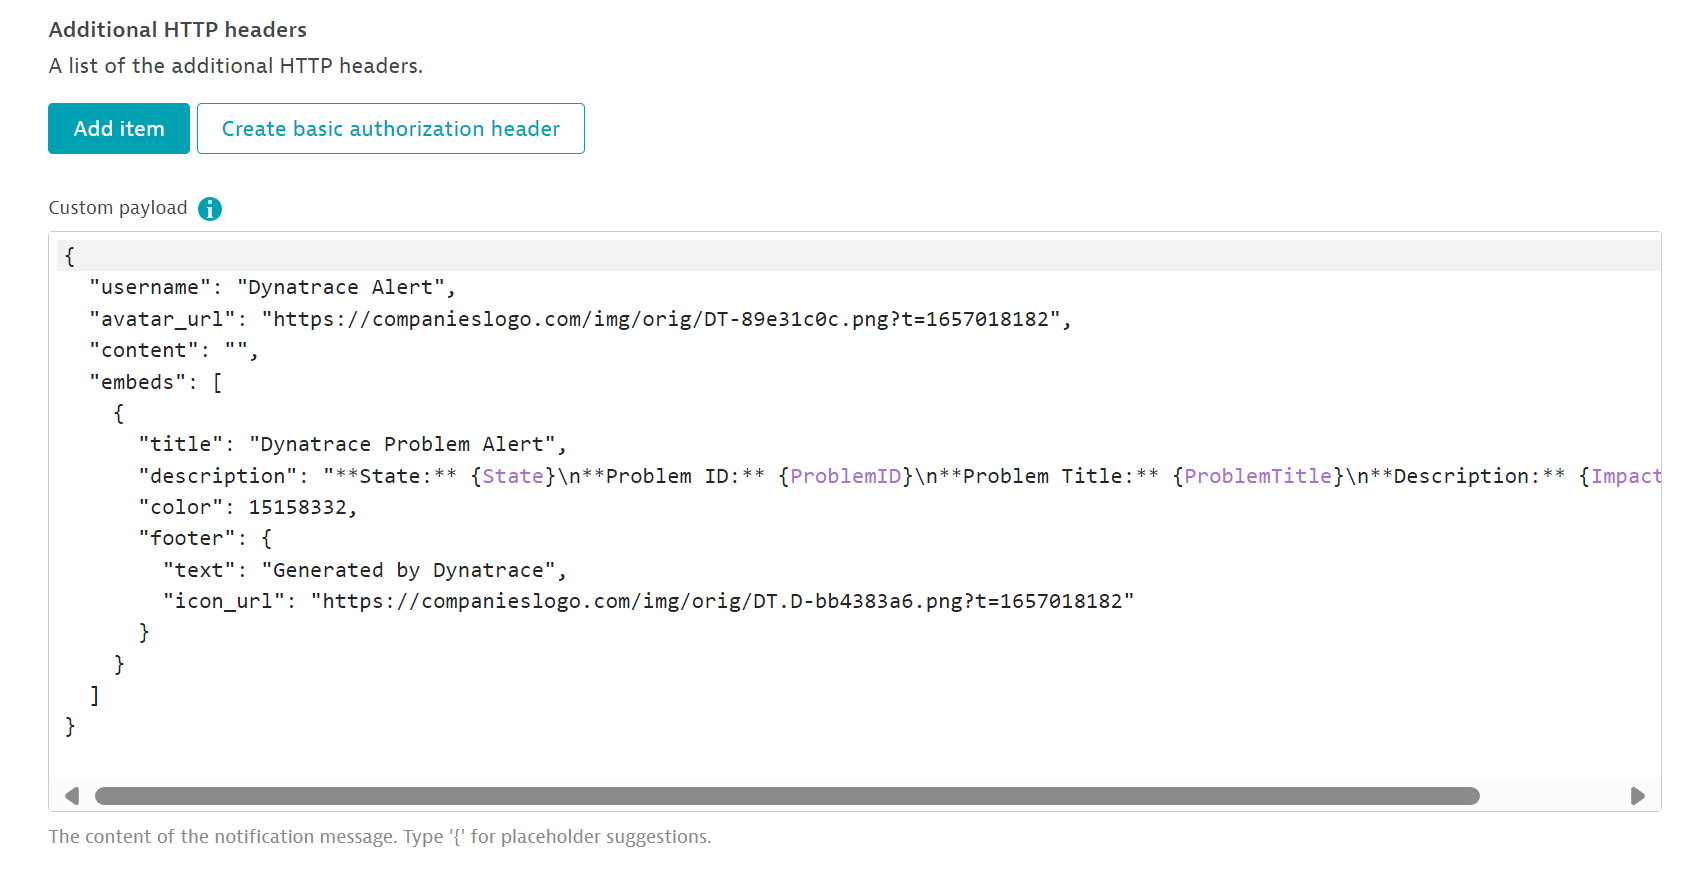
{
"username": "Dynatrace Alert",
"avatar_url": "https://companieslogo.com/img/orig/DT-89e31c0c.png?t=1657018182",
"content": "",
"embeds": [
{
"title": "Dynatrace Problem Alert",
"description": "**State:** {State}\n**Problem ID:** {ProblemID}\n**Problem Title:** {ProblemTitle}\n**Description:** {ImpactedEntity}",
"color": 15158332,
"footer": {
"text": "Generated by Dynatrace",
"icon_url": "https://companieslogo.com/img/orig/DT.D-bb4383a6.png?t=1657018182"
}
}
]
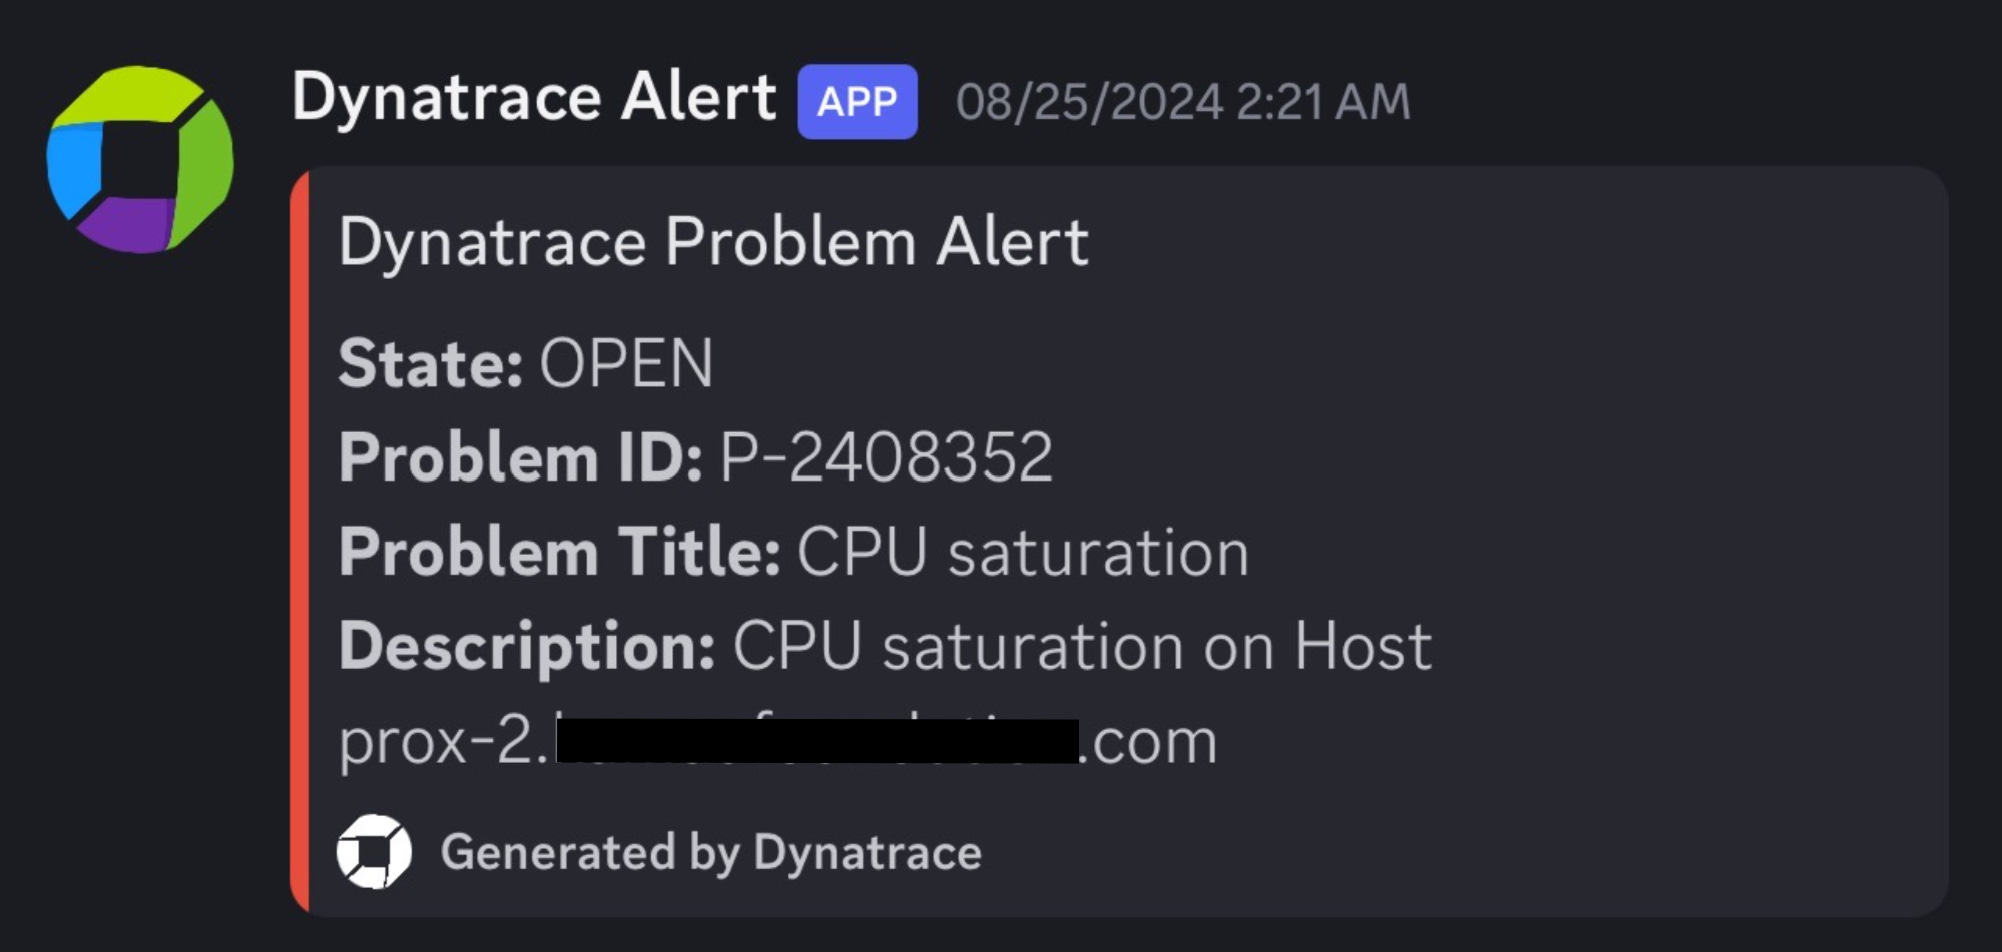
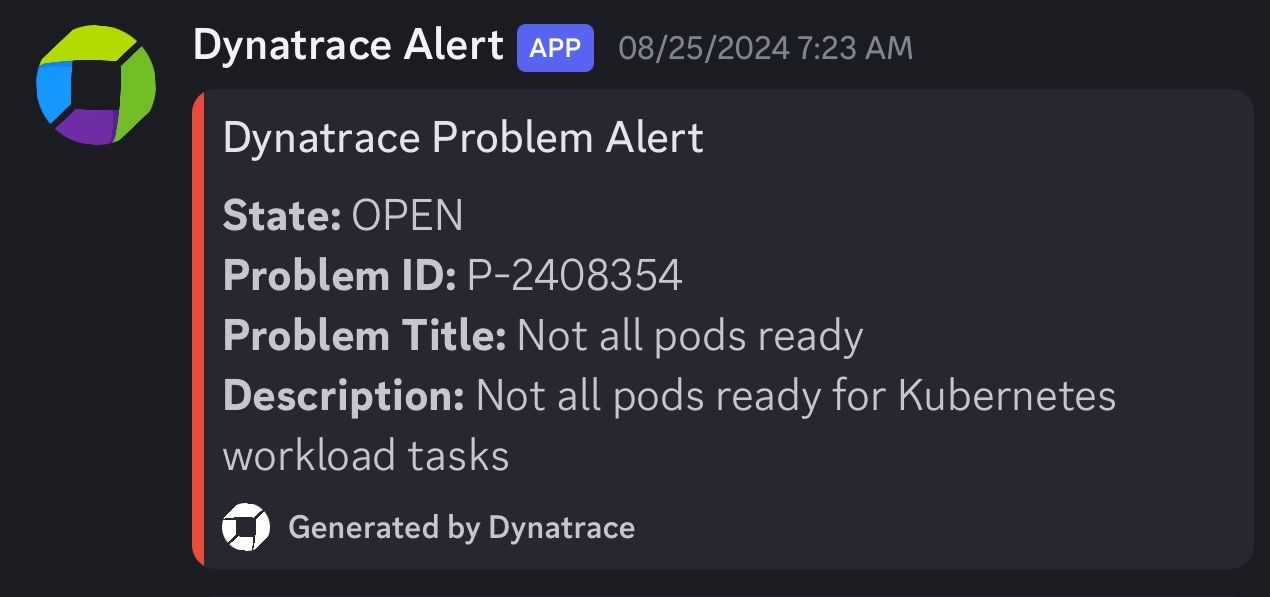
}Hopefully, you don’t have to get any alerts but often computers fail:
Kubernetes
Unfortunately for me, my applications and servers run primarily in Kubernetes. Even more unfortunately, I am doing GitOps for deploying things into k8s. I say that to say, deploying Dynatrace’s Kubernetes monitoring wasn’t as straightforward as the docs say. Speaking of Kubernetes monitoring, because I use Talos Linux for my k8s cluster, I’m unable to use Dynatrace’s premier offering of Cloud Native Full Stack. If someone finds a way to get this working, please let me know.
Dynatrace has docs for ArgoCD users, but I don’t use ArgoCD either. For the FluxCD users of the world, here you go:
OCIRepository:
---
apiVersion: source.toolkit.fluxcd.io/v1beta2
kind: OCIRepository
metadata:
  name: dynatrace
  namespace: flux-system
spec:
  interval: 24h
  url: oci://public.ecr.aws/dynatrace/dynatrace-operator
  ref:
    tag: 1.2.2
helmrelease.yaml:
---
apiVersion: helm.toolkit.fluxcd.io/v2
kind: HelmRelease
metadata:
  name: dynatrace
  namespace: flux-system
spec:
  interval: 10m
  chartRef:
    kind: OCIRepository
    name: dynatrace
    namespace: flux-system
  install:
    crds: Create
    timeout: 7m
  timeout: 7m
  releaseName: dynatrace-operator
  targetNamespace: dynatrace
  upgrade:
    crds: CreateReplace
    disableWait: true
    cleanupOnFail: true
    remediation:
      strategy: rollback
      retries: 3
dynakube.yaml:
---
apiVersion: dynatrace.com/v1beta2
kind: DynaKube
metadata:
  name: ${CLUSTER_NAME}
  namespace: dynatrace
  annotations:
    feature.dynatrace.com/k8s-app-enabled: "true"
spec:
  apiUrl: ${DYNATRACE_TENANT_URL}
  metadataEnrichment:
    enabled: true
  oneAgent:
    applicationMonitoring:
      useCSIDriver: true
  activeGate:
    capabilities:
      - kubernetes-monitoring
      - routing
      - metrics-ingest
      - dynatrace-api
    resources:
      requests:
        cpu: 100m
        memory: 128Mi
      limits:
        cpu: 500m
        memory: 1Gi
    group: "Enterprise"
externalsecret.yaml:
apiVersion: external-secrets.io/v1beta1
kind: ExternalSecret
metadata:
  name: dynatrace-api-key
  namespace: dynatrace
spec:
  refreshInterval: 8h
  secretStoreRef:
    name: vault-backend
    kind: ClusterSecretStore
  target:
    name: longhorn-talos
    creationPolicy: 'Orphan'
  data:
  - secretKey: apiToken
    remoteRef:
      key: kube/dynatrace
      property: apiToken
Not everyone configures their Flux repositories the same, so place the files wherever you see fit. Fluent-bit also has a reference from the k8s downward API which causes the installation to fail through Flux:
      - name: NODE_IP
        valueFrom:
          fieldRef:
            apiVersion: v1
            fieldPath: status.hostIP
Again if someone figures out a way around this, please let me know. This is the ONLY thing in my cluster so far which is not installed through Git.
helm install fluent-bit fluent/fluent-bit -f fluent-bit-values\(3\).yaml --namespace dynatrace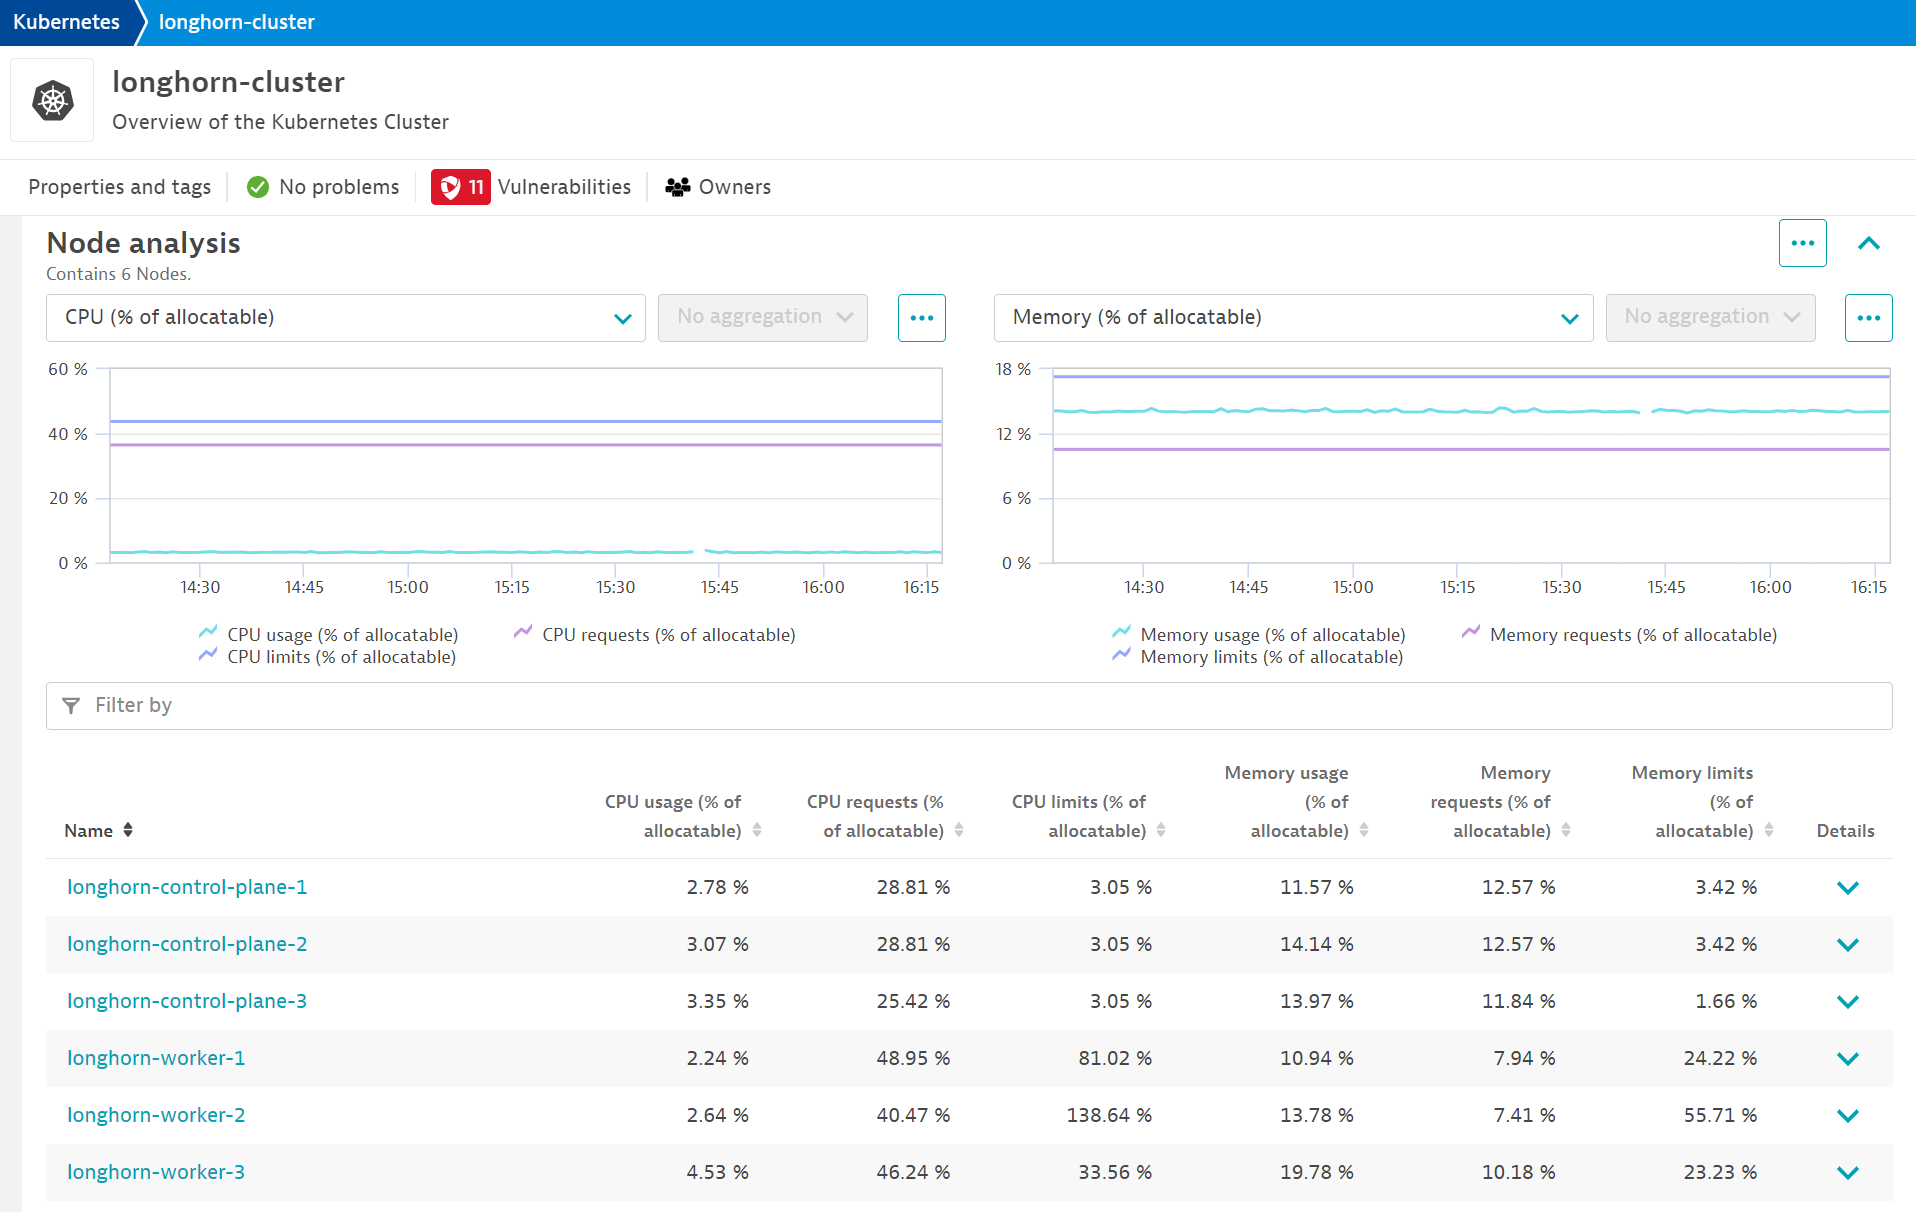
High Availability
I’m not yet wealthy enough for my homelab to be fault-tolerant. I can’t justify spending money on multiple 8TB NVMe SSDs and replicating them with Ceph in Proxmox. I’ll let Longhorn handle most of the replication (I’ll get into this later). A few things are running in my homelab that I do consider critical though. i.e.
DNS - No DNS = No Internet
Vault - No secrets = CrashLoopBackOff
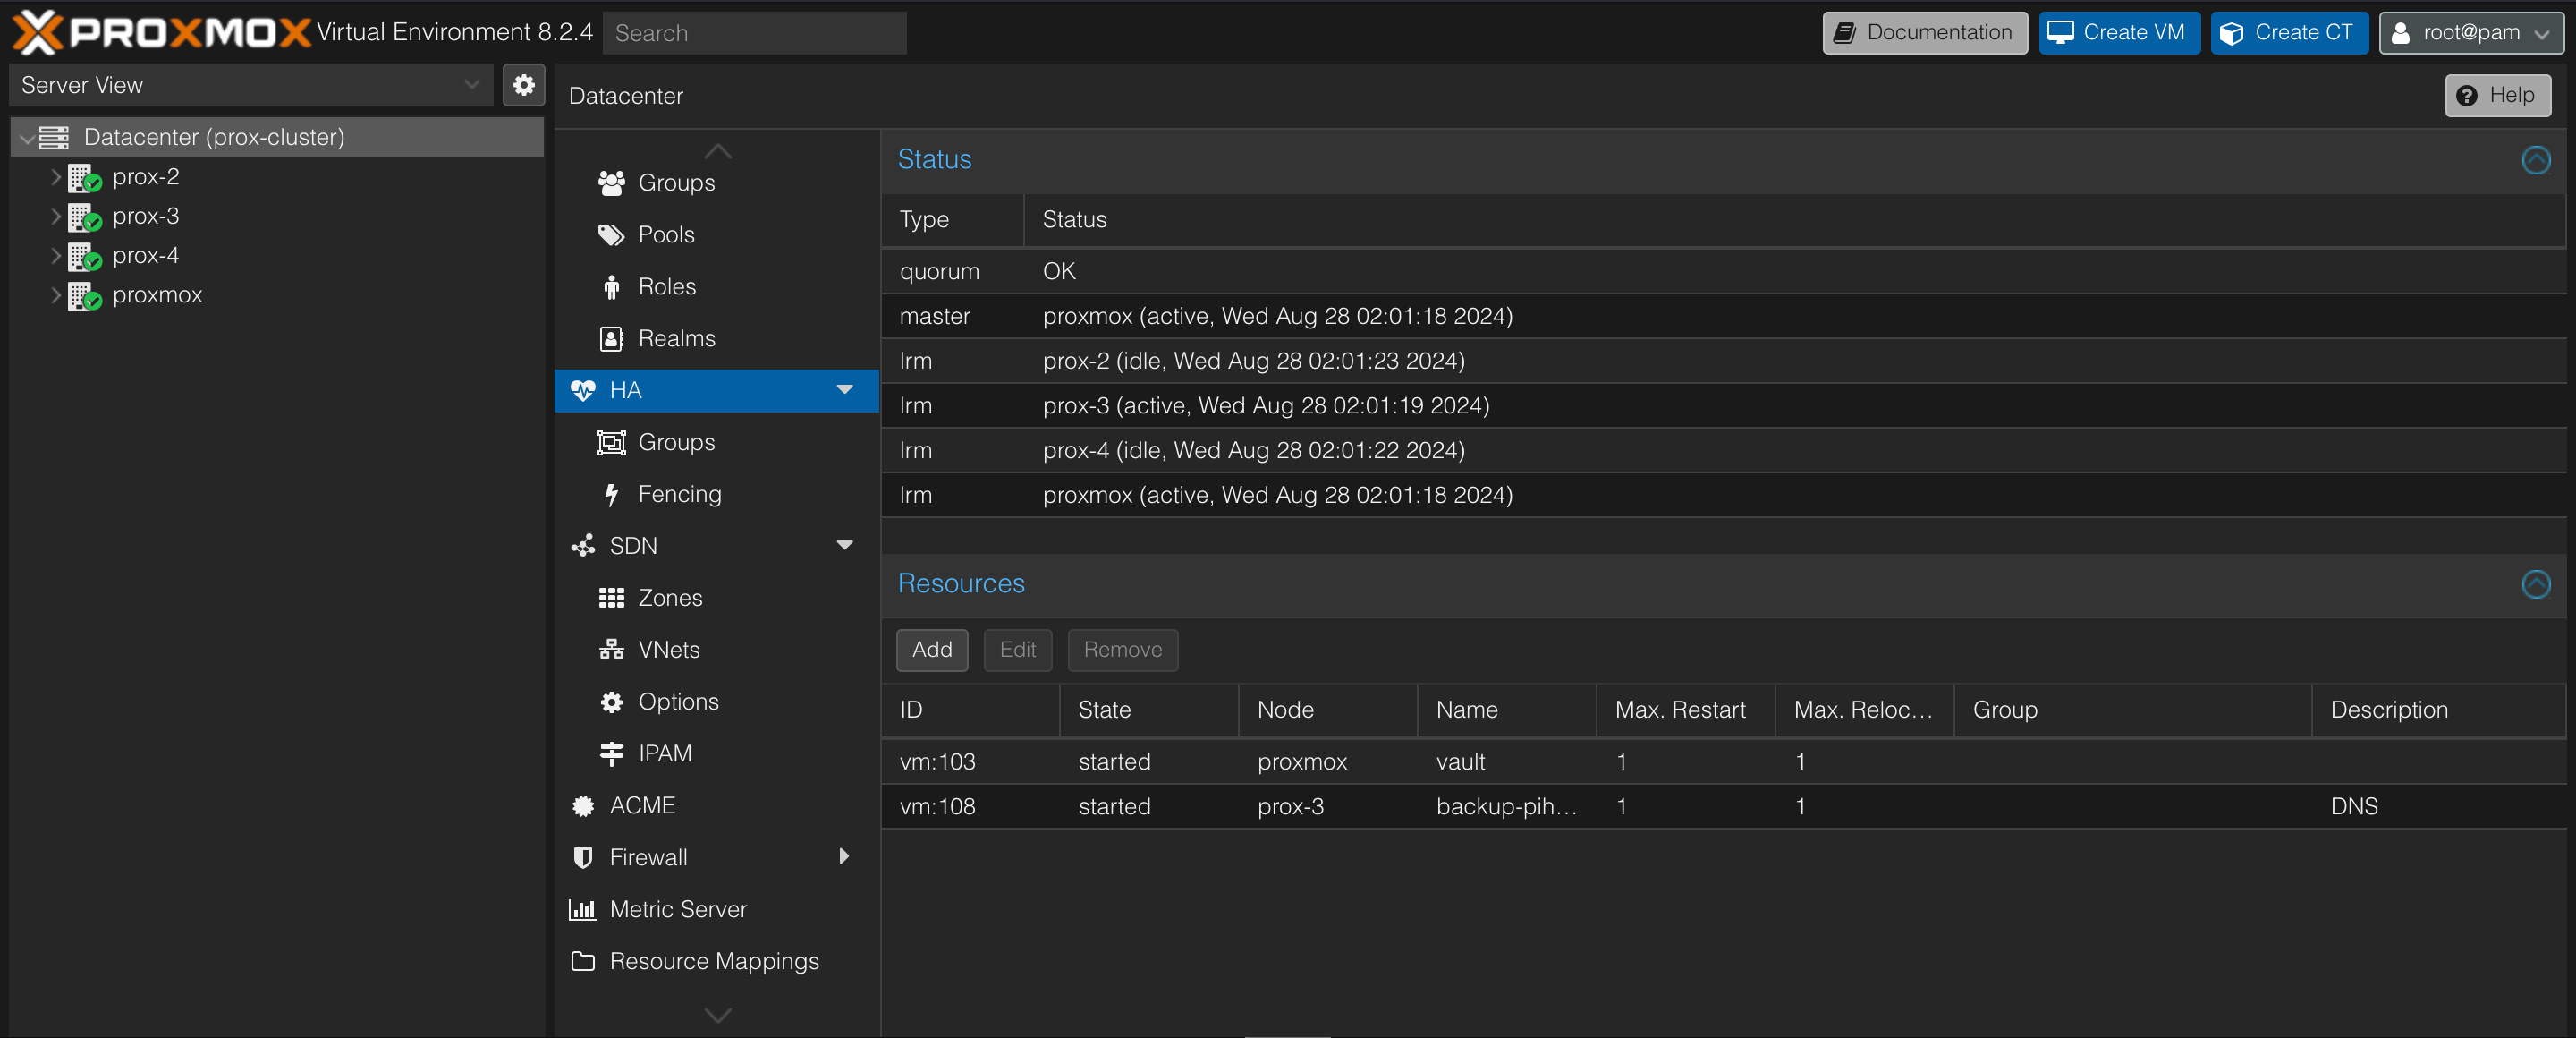
I already have redundant, synced DNS servers that run on two completely different hypervisors. Don’t fact-check me but so long as I have VMs with the same underlying storage, think mounting the same NFS share to multiple hosts, I can turn on HA in Proxmox and they will be started on another host if a host goes down.
Longhorn also handles replication of PVCs out of the box, which is why decreasing my storage but half by running CEPH on Proxmox was never an option. You can set the policy on the number of replicas in Longhorn inside of the helm chart:
persistence:
  # -- Replica count of the default Longhorn StorageClass.
  defaultClassReplicaCount: 3
This makes life pretty easy, Kubernetes implements high availability by OOTB by rescheduling pods on other nodes after one has been in NotReady status for over 5 minutes. If a PVC is replicated across three worker nodes, when it is time to reschedule pods for one failed worker node (maybe it dropped off the network or something), the PVC is already there and does not leave the pod stuck terminating and restarting. Consequently, if a node that has most of Nextcloud’s pods scheduled on it goes down, the pods are rescheduled and the data is still present.
Status Page
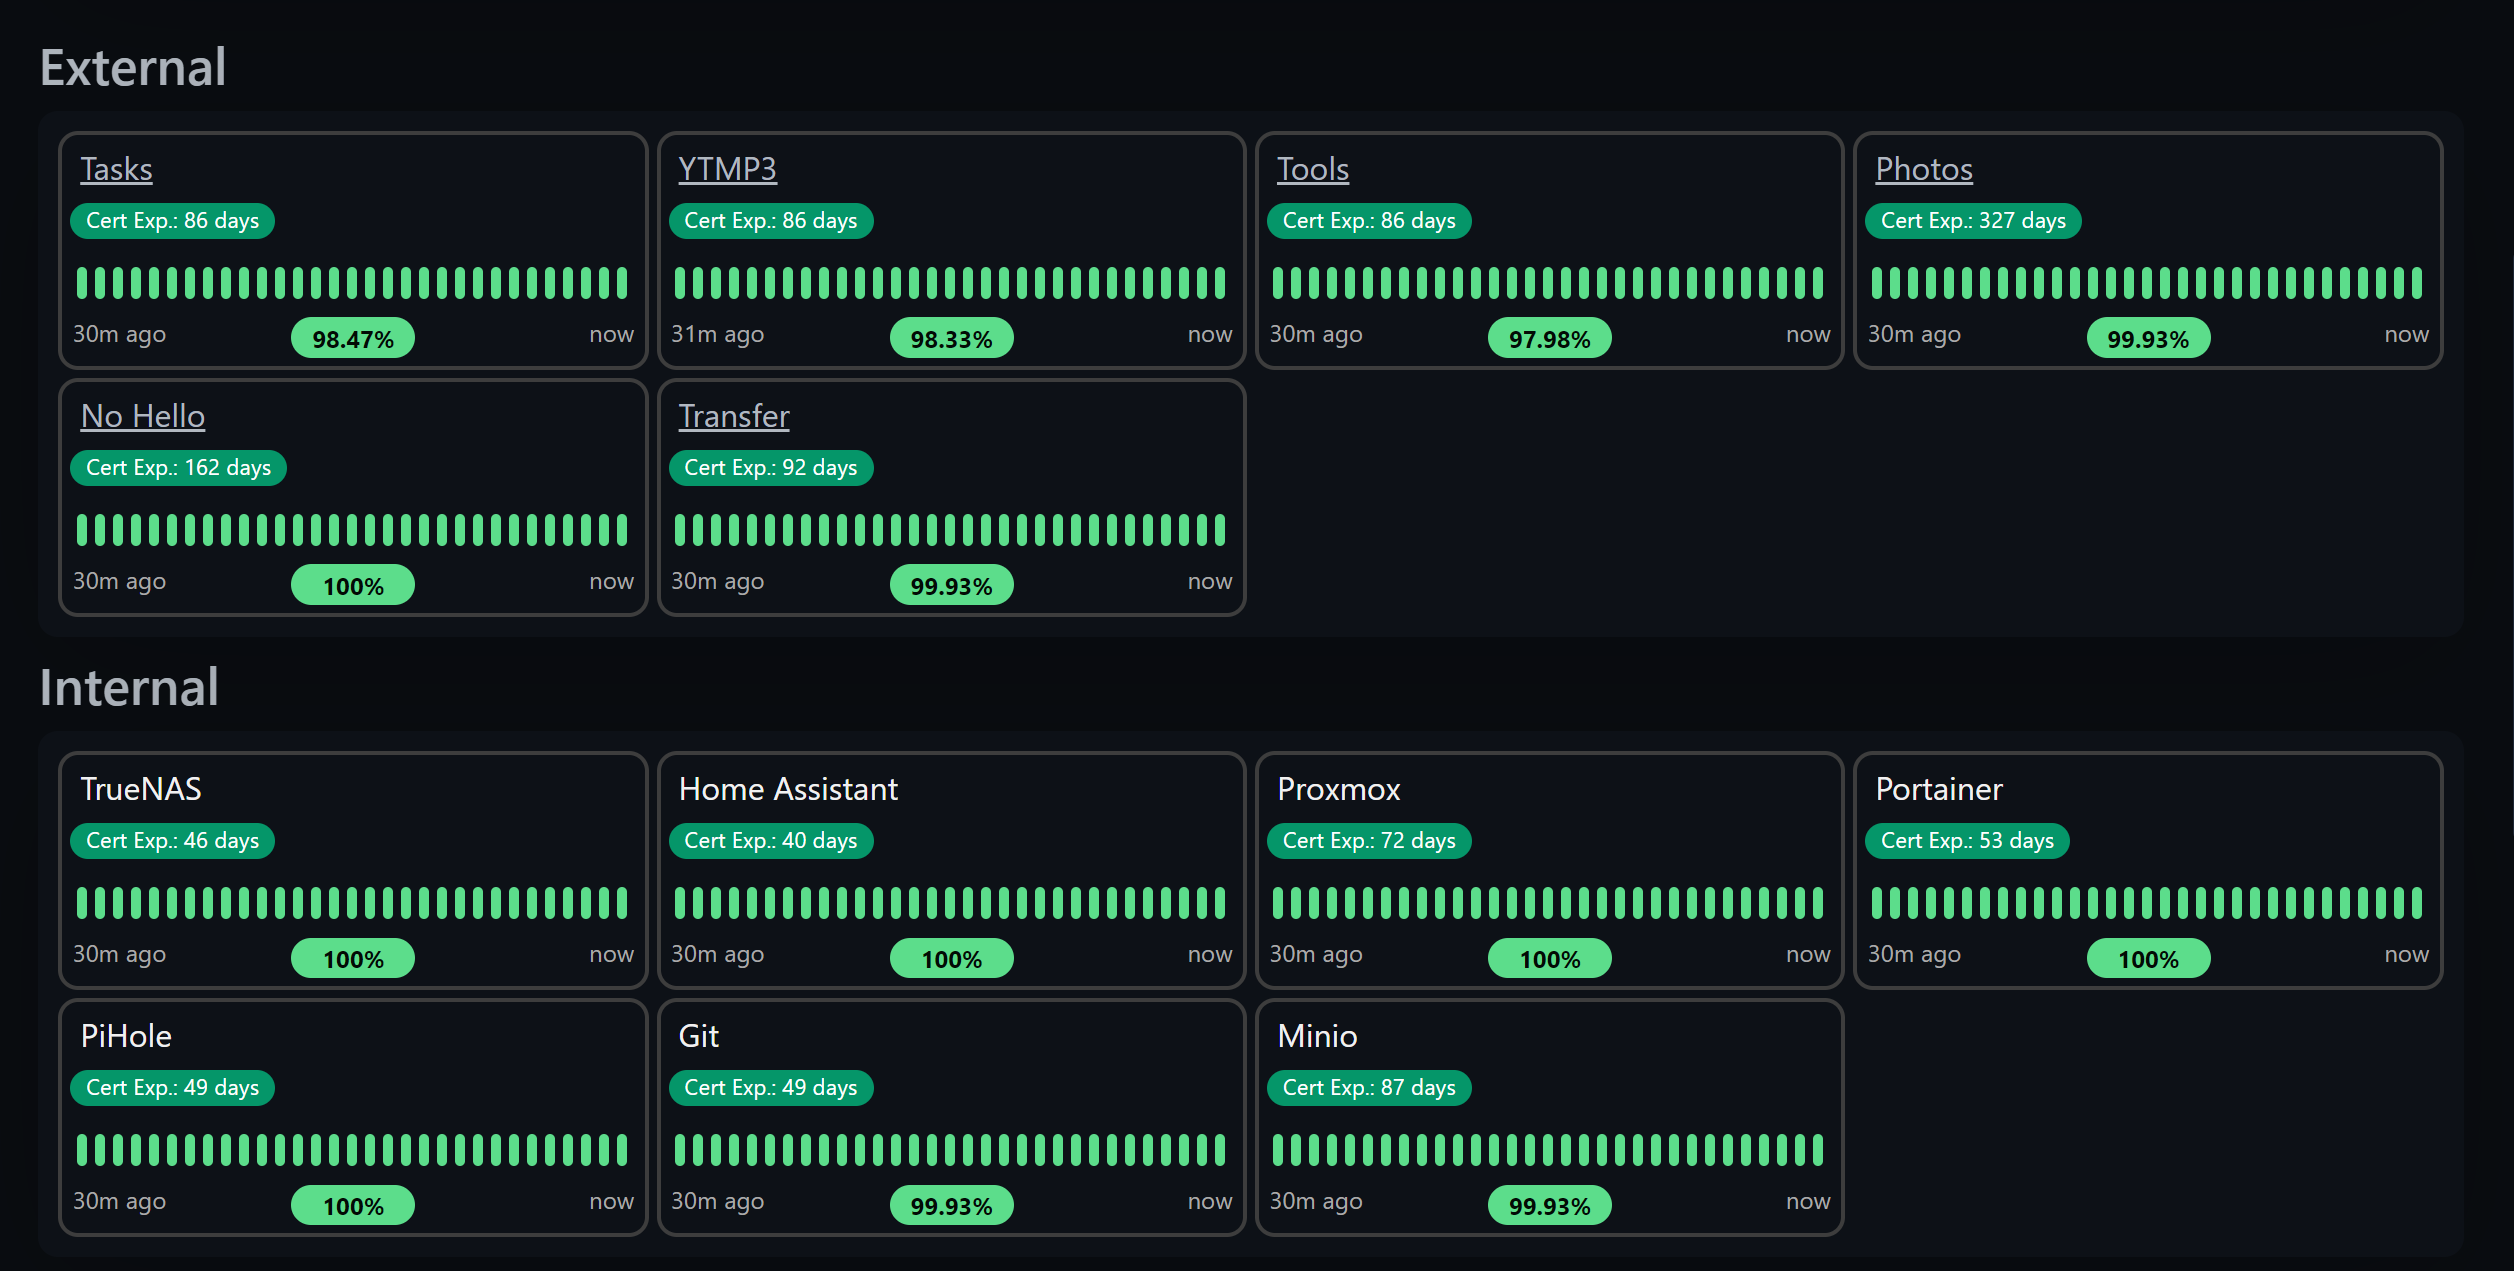
Uptime Kuma
Uptime Kuma is an “easy-to-use self-hosted monitoring tool” that I enjoy. Of course, this is the most basic monitoring you can get. No real metrics besides response time, response codes, latency, and certificate expiry, however, it still makes for a good tool for basic alerting and my favorite, a public status page.
Uptime Kuma supports its fair share of protocols, enough to get the uptime monitoring you need.
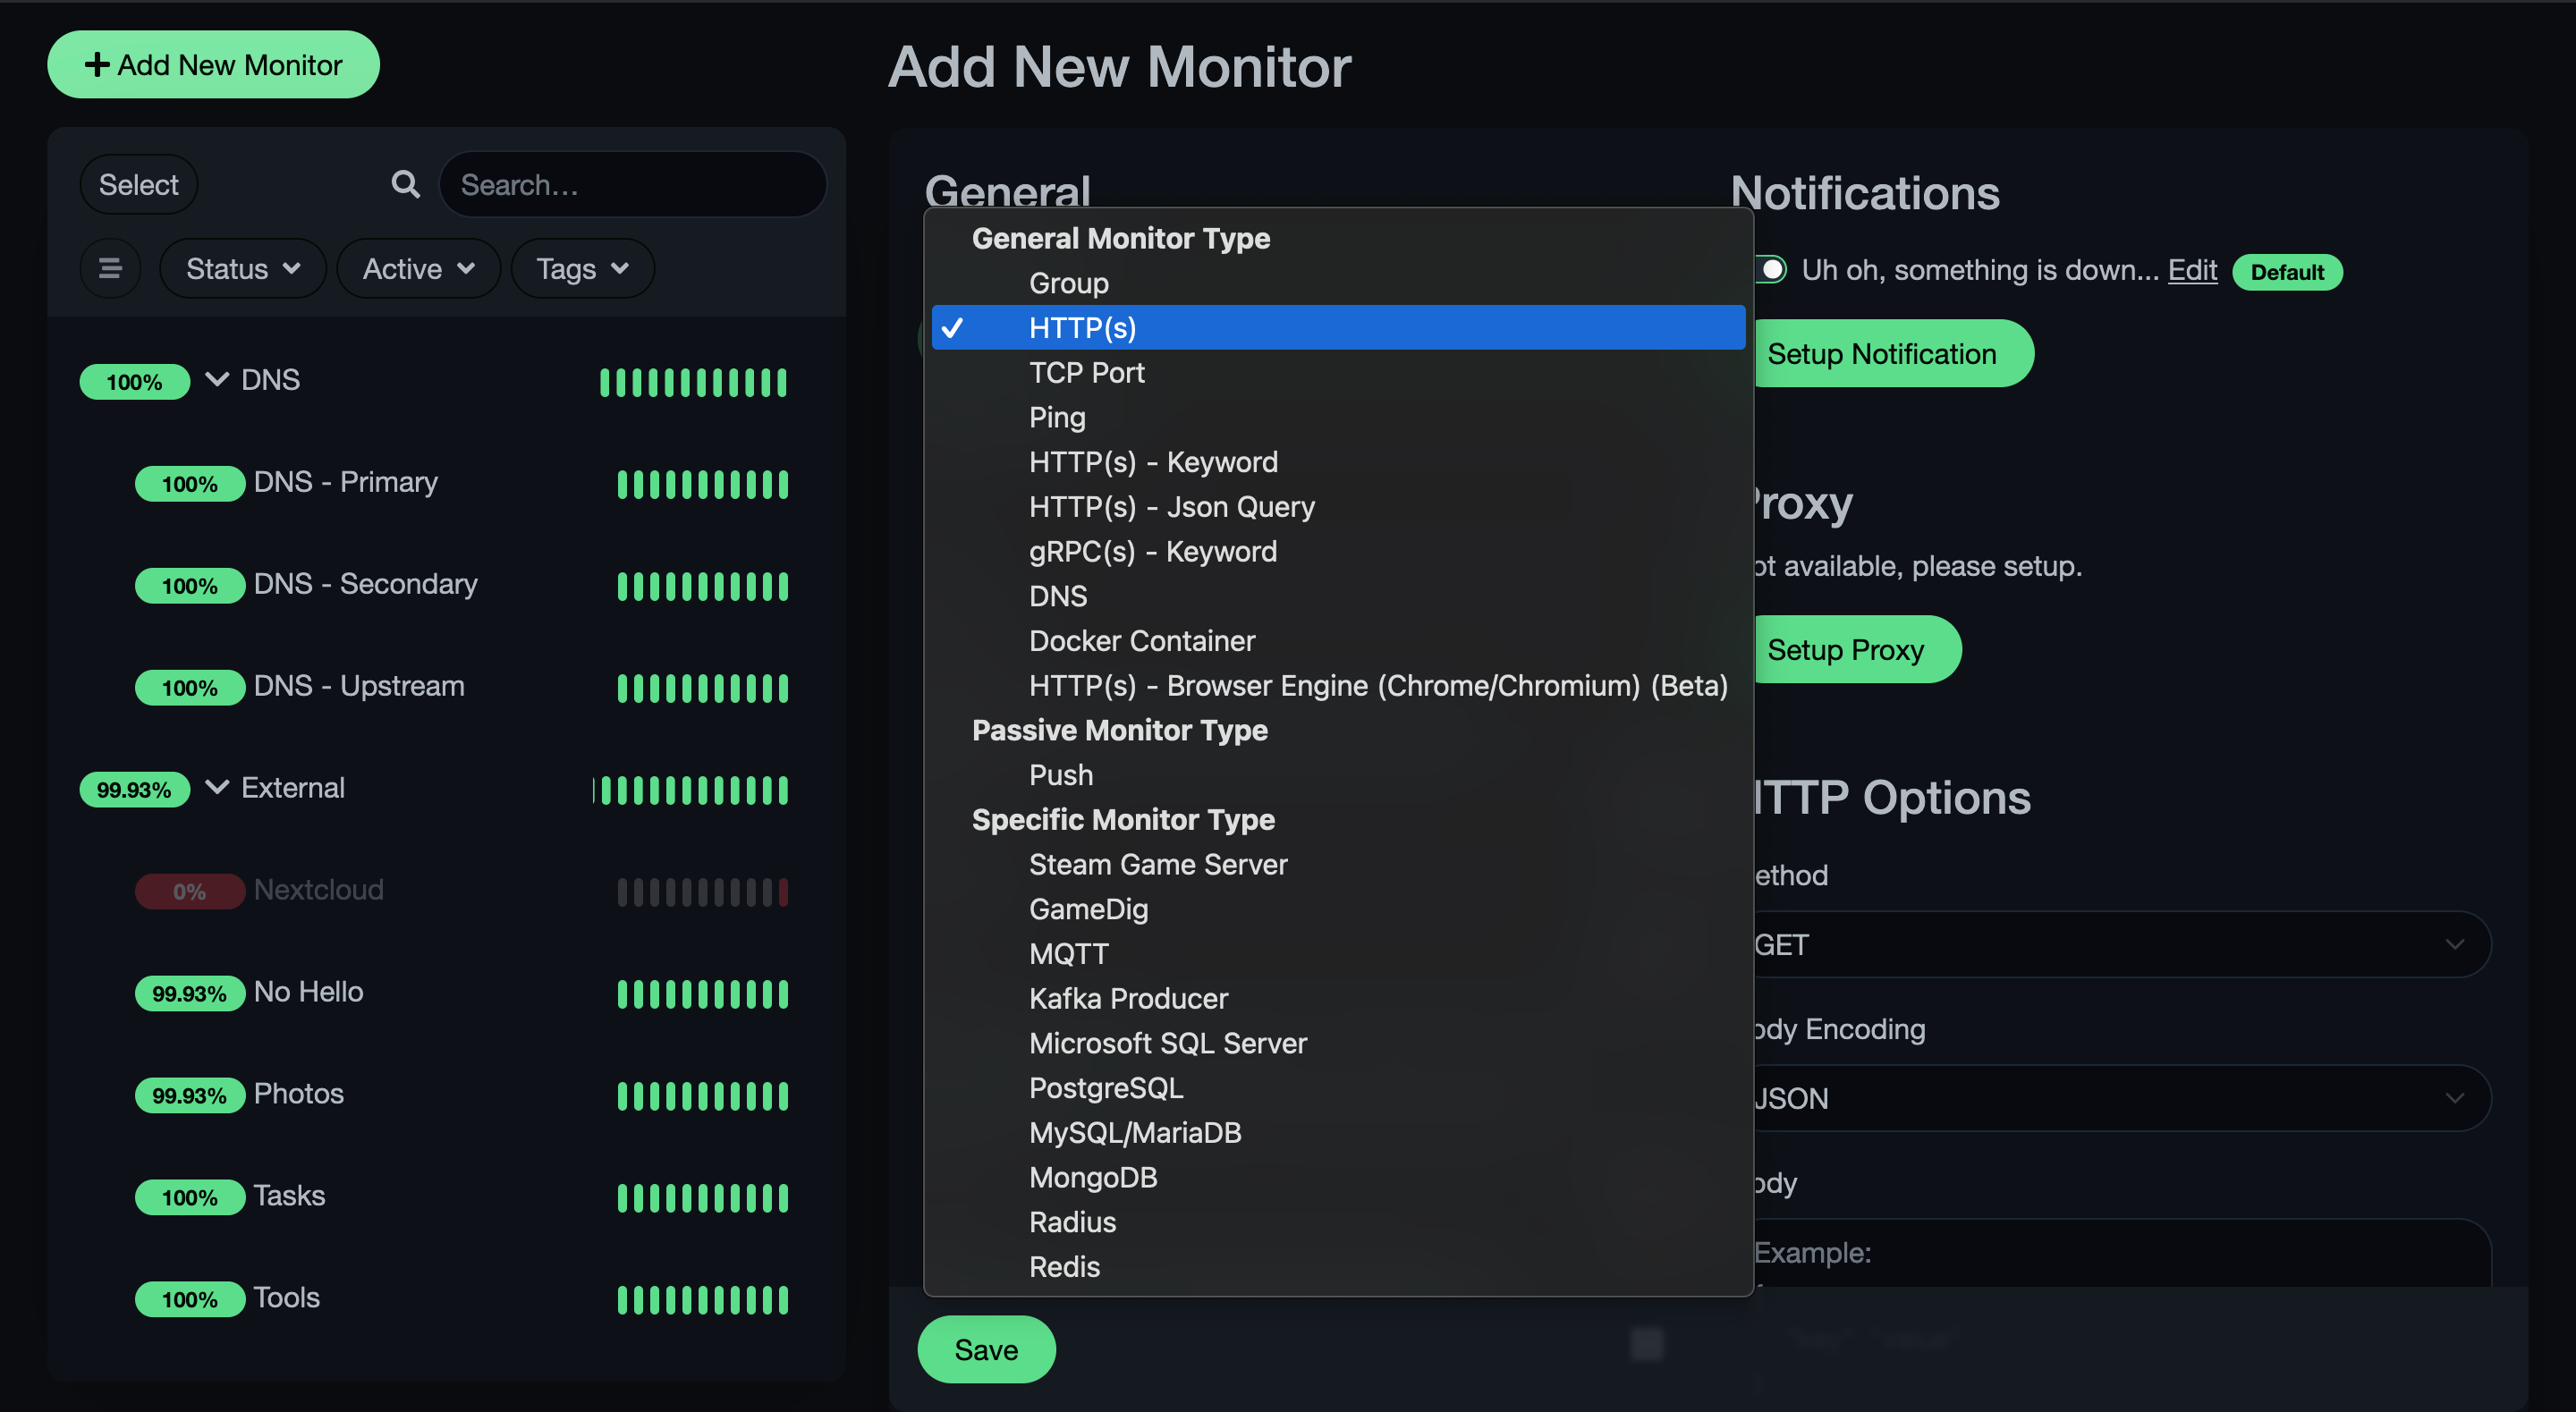
I use pings more for host monitoring, HTTP for their URLs if they have an application running on them, DNS queries for DNS of course, and PostgreSQL for my database monitoring.
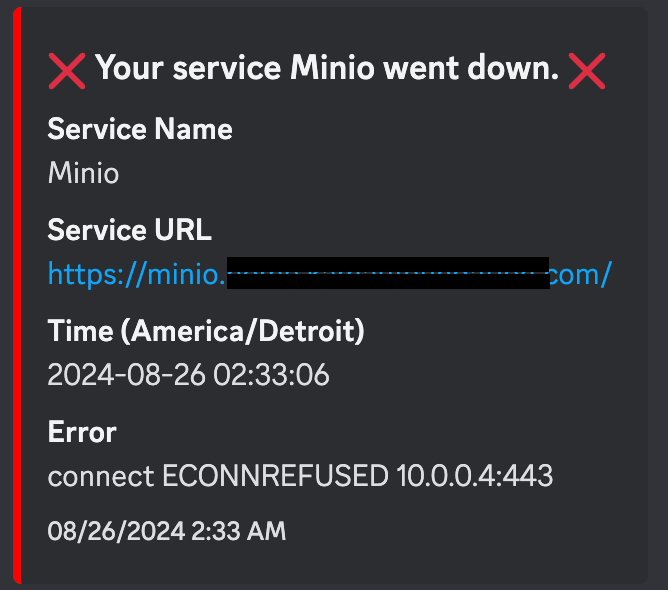
This being a self-hosted, homelaber monitoring tool, Discord alerts are supported, unlike Dynatrace. Just input your webhook URL and you’re good to go.
Lastly, you can create a public status page under your domain by creating a status page, adding your domain to the domains section, and taking some custom CSS I found so your status page doesn’t look immature
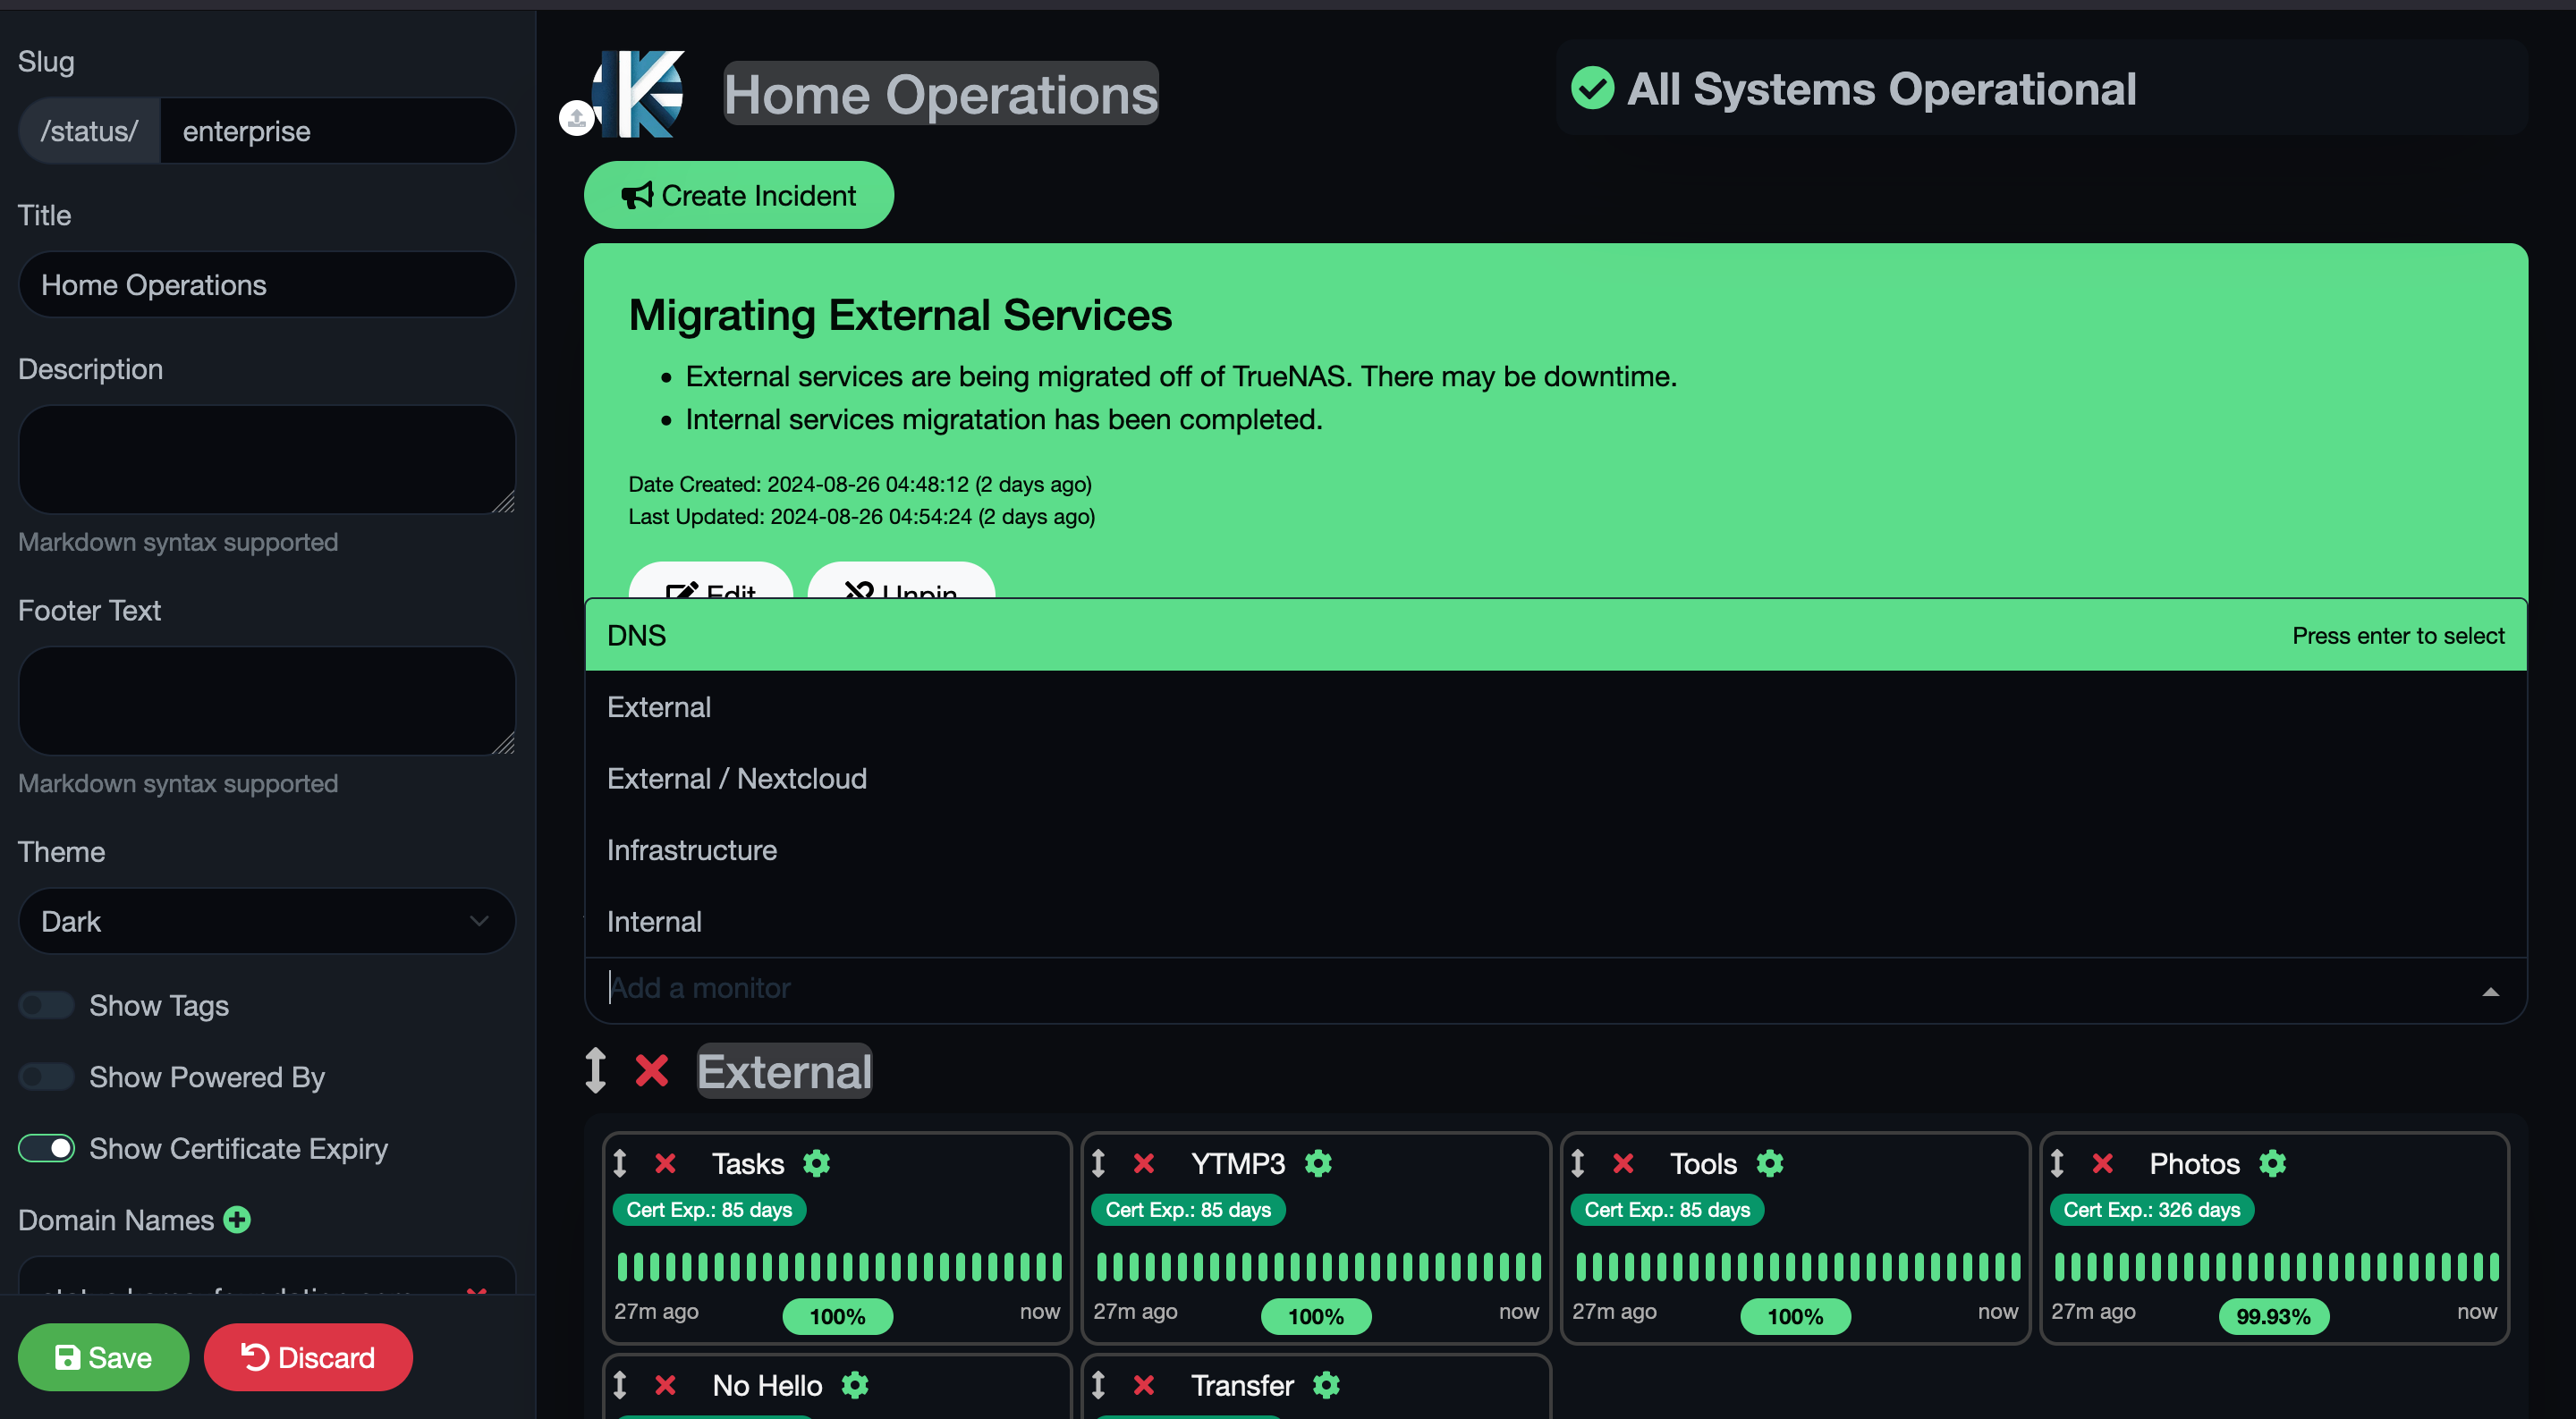
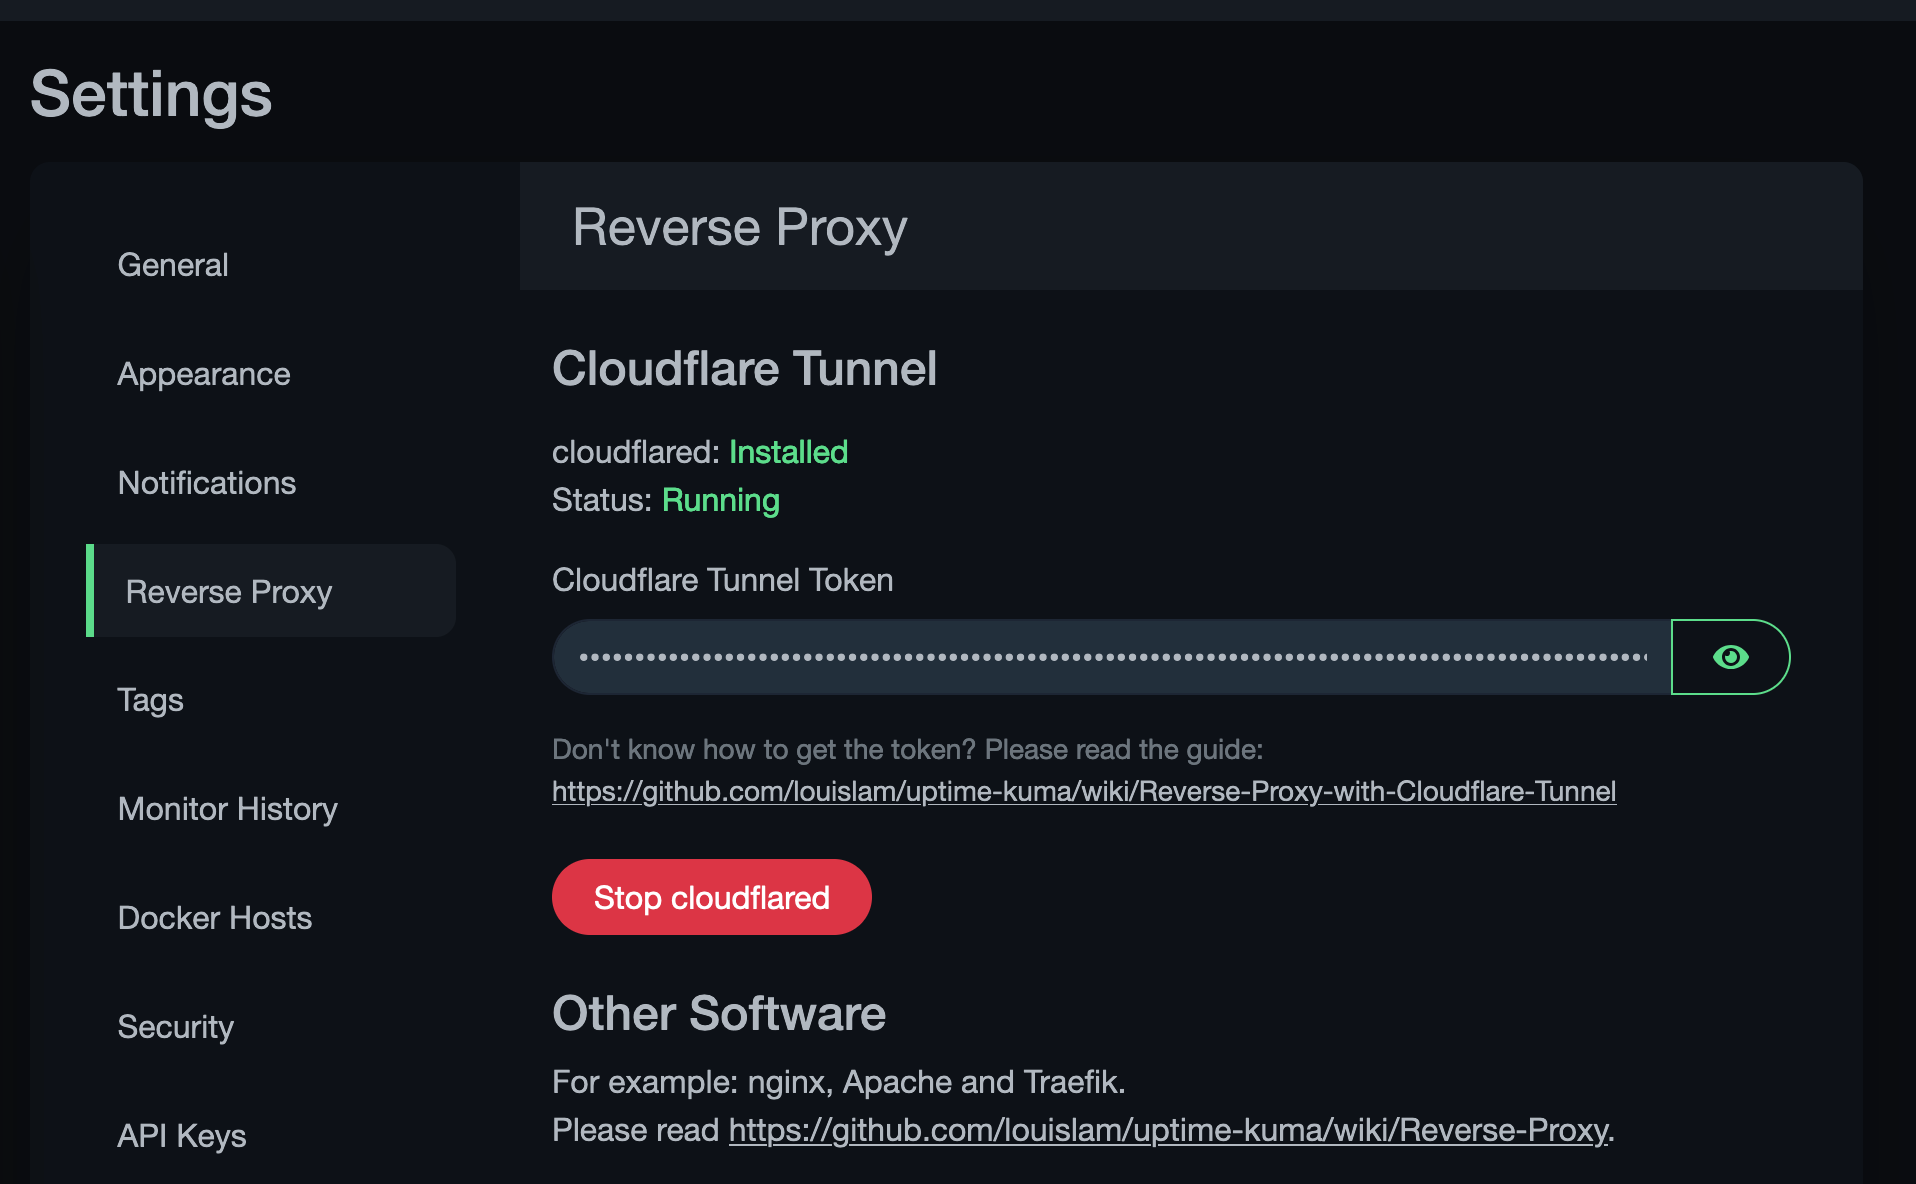
Like I said, all green on this page means I don’t have to wake up around the time I am writing this post (3 AM…). If you have a domain name registered in Cloudflare, Uptime Kuma comes with Clouflared installed so you can create a Cloudflare Tunnel in about 30 seconds.
TL;DR
I’m working on maturing my homelab with redundancy, monitoring, and high availability so I can go out of town and sleep comfortably knowing if something breaks, at least I will know. I use Dynatrace for host monitoring, physical and virtual, Promox HA for critical VMs, Longhorn reduces the need for some of the HA capabilities in Proxmox, and Uptime Kuma for a high-level overview/status of my applications, hosts, and services.